Published 7 hours ago
On January 9th, the Solana coin price gave a high momentum breakout from the monthly resistance of $15. This bullish breakout offers a higher footing for buyers to bolster further price recovery. Moreover, the low volume retest to the breached resistance gives an additional confirmation for price sustainability above the $15 support.
advertisement
Key points
- The lower price rejection candles at the $15 level indicate the buyers are defending the newly obtained support
- the reclaimed 20-and-50-day EMAs provide an extra edge in the buyer’s favor.
- The 24-hour trading volume in the Solana coin is $59.1 Million, indicating a 33% loss
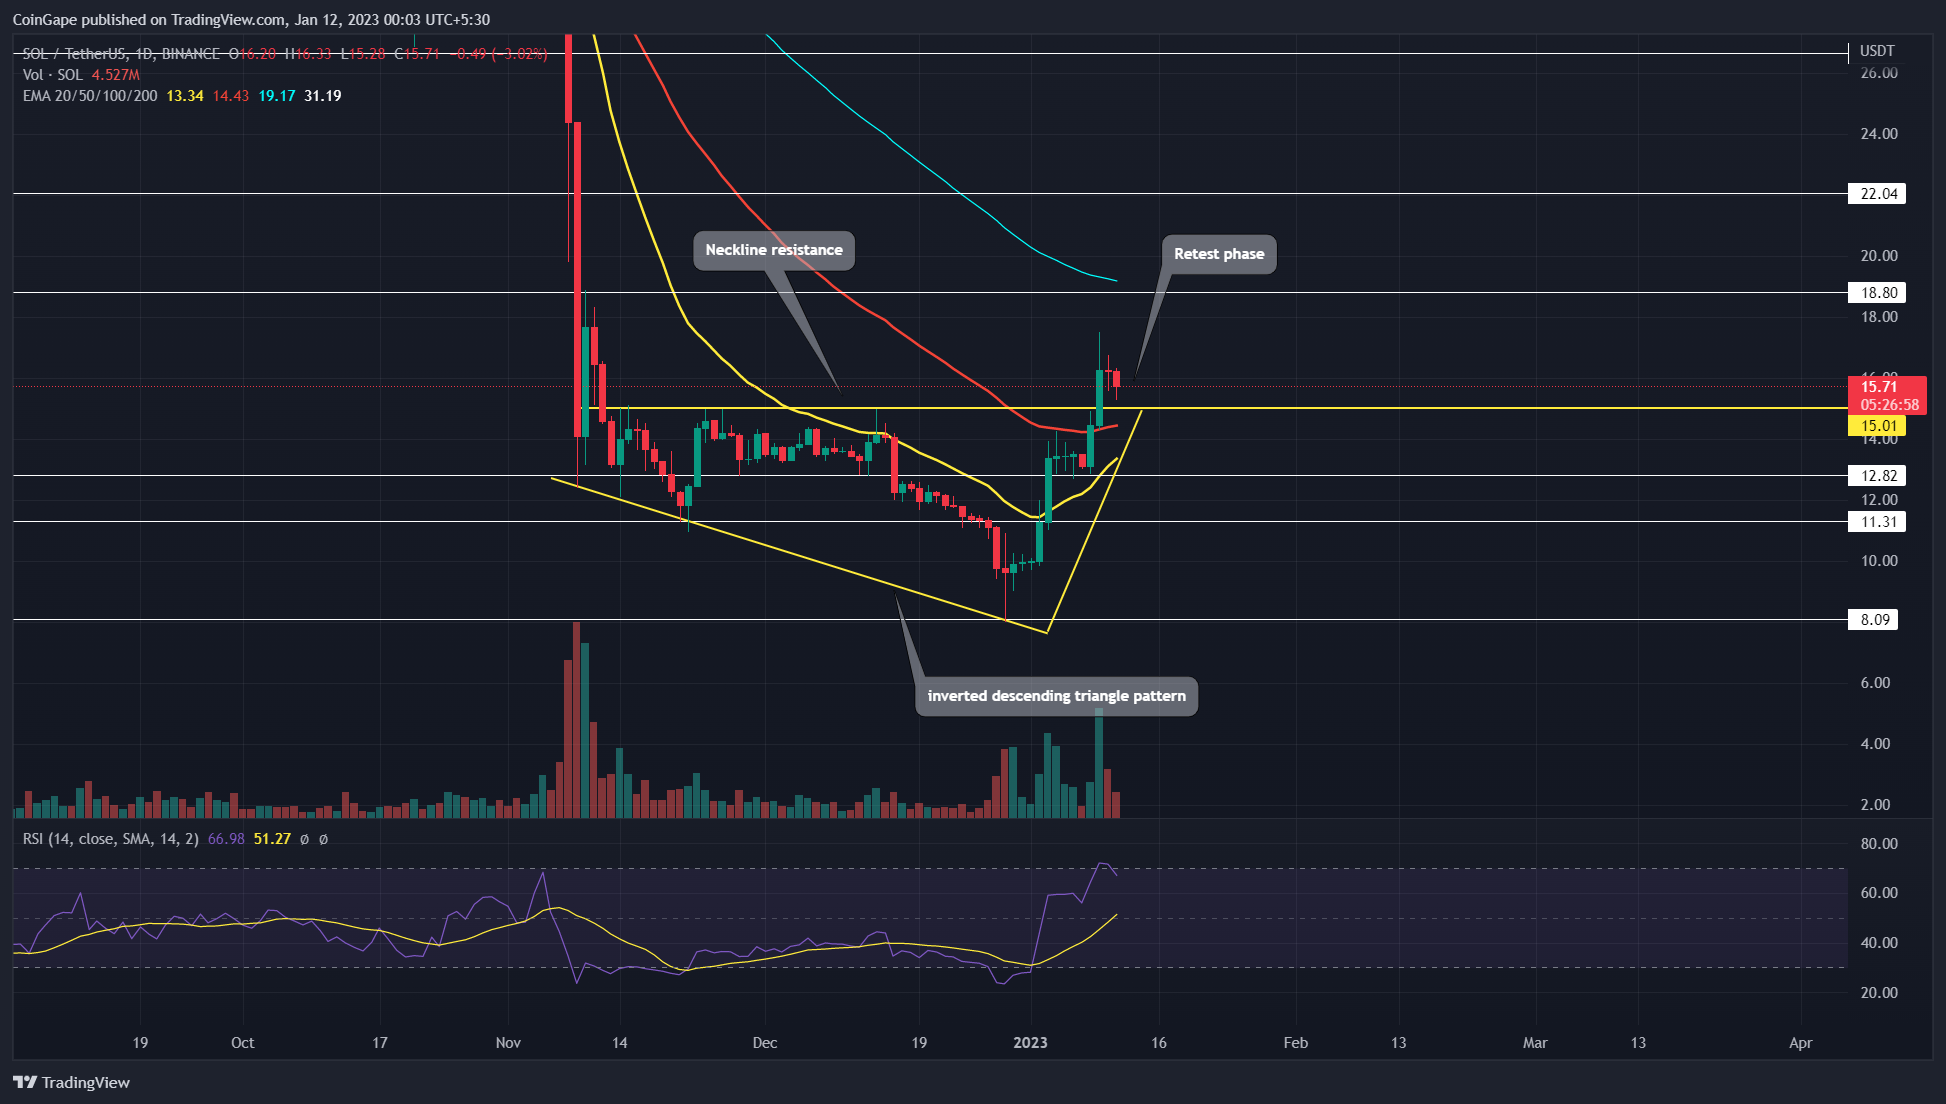
Source-Tradingview
The Solana coin price walking a sideway trend for the last two months shows the formation of an inverted descending triangle pattern. During this pattern formation, the price action faces stiff resistance from a horizontal level and a downsloping support trendline which leads the lower swing laws. Moreover, the prices expanding within this pattern reflect a sense of high volatility in the crypto market.
This pattern may not be commonly observed in technical charts, but it can provide a significant bullish rally upon the Breakout of its neckline resistance. Amid the recent recovery in the market and support from the downsloping trendline, the SOL price has recently bounced back from the $8 mark.
Trending Stories
Also read- Explained: What is Physical NFT? and How to Sell Physical Items as NFT
This bullish reversal doubled the coin’s market value within a fortnight and provided an upward breakout from the $15 neckline. The long bullish candle pierced the mentioned barrier with sufficient volume, indicating the buyer’s commitment to potential recovery.
However, in the last two days, the SOL price showed a minor pullback to retest the breached resistance as potential support. Moreover, this retest phase back by decreasing volume indicates less interest of traders in selling activity.
Thus, if the coin buyers manage to sustain about the $15 flip support, the resulting rally may push the prices to $18.8, followed by the $22 mark.
On a contrary note, a daily candle closing below the $15 level will weaken the bullish thesis.
Technical indicator
RSI: The daily RSI slope high above in bullish territory indicates the market participants feel positive about price recovery.
advertisement
Bollinger band: the Solana coin price hitting the upper band of the indicator suggests a rapid bullish rally in the relatively short period. Thus, the coin price is likely to consolidate above $15 support until the prices stabilize enough to resume its rally.
Solana coin price intraday levels
- pot price: $16.02
- Trend: Bearish
- Volatility: High
- Resistance level- $18.8 and $22
- Support level- $15 and $12.8
Share this article on:
The presented content may include the personal opinion of the author and is subject to market condition. Do your market research before investing in cryptocurrencies. The author or the publication does not hold any responsibility for your personal financial loss.
- SEO Powered Content & PR Distribution. Get Amplified Today.
- Platoblockchain. Web3 Metaverse Intelligence. Knowledge Amplified. Access Here.
- Source: https://coingape.com/markets/bulls-regaining-trend-control-may-surge-solana-coin-by-18/

