
Published 8 hours ago
BTC Price Prediction: The Bitcoin price showed an unclear trend for the first week of March, creating a sense of uncertainty in the market. However, the second week started on a bearish note as the coin price witnessed 4% in the last three days. As of now, this downfall halts at a strong support 0.382 Fibonacci retracement level, holding the hope of coin holders. Can BTC price resume a bullish recovery from here?
advertisement
Key Points:
- The Bitcoin price spread narrowing within the falling wedge pattern indicates a breakout opportunity nearby.
- The ongoing correction phase in BTC price will continue until the wedge pattern is intact.
- The intraday trading volume in Bitcoin is $21 Billion, indicating a 7.2% loss.
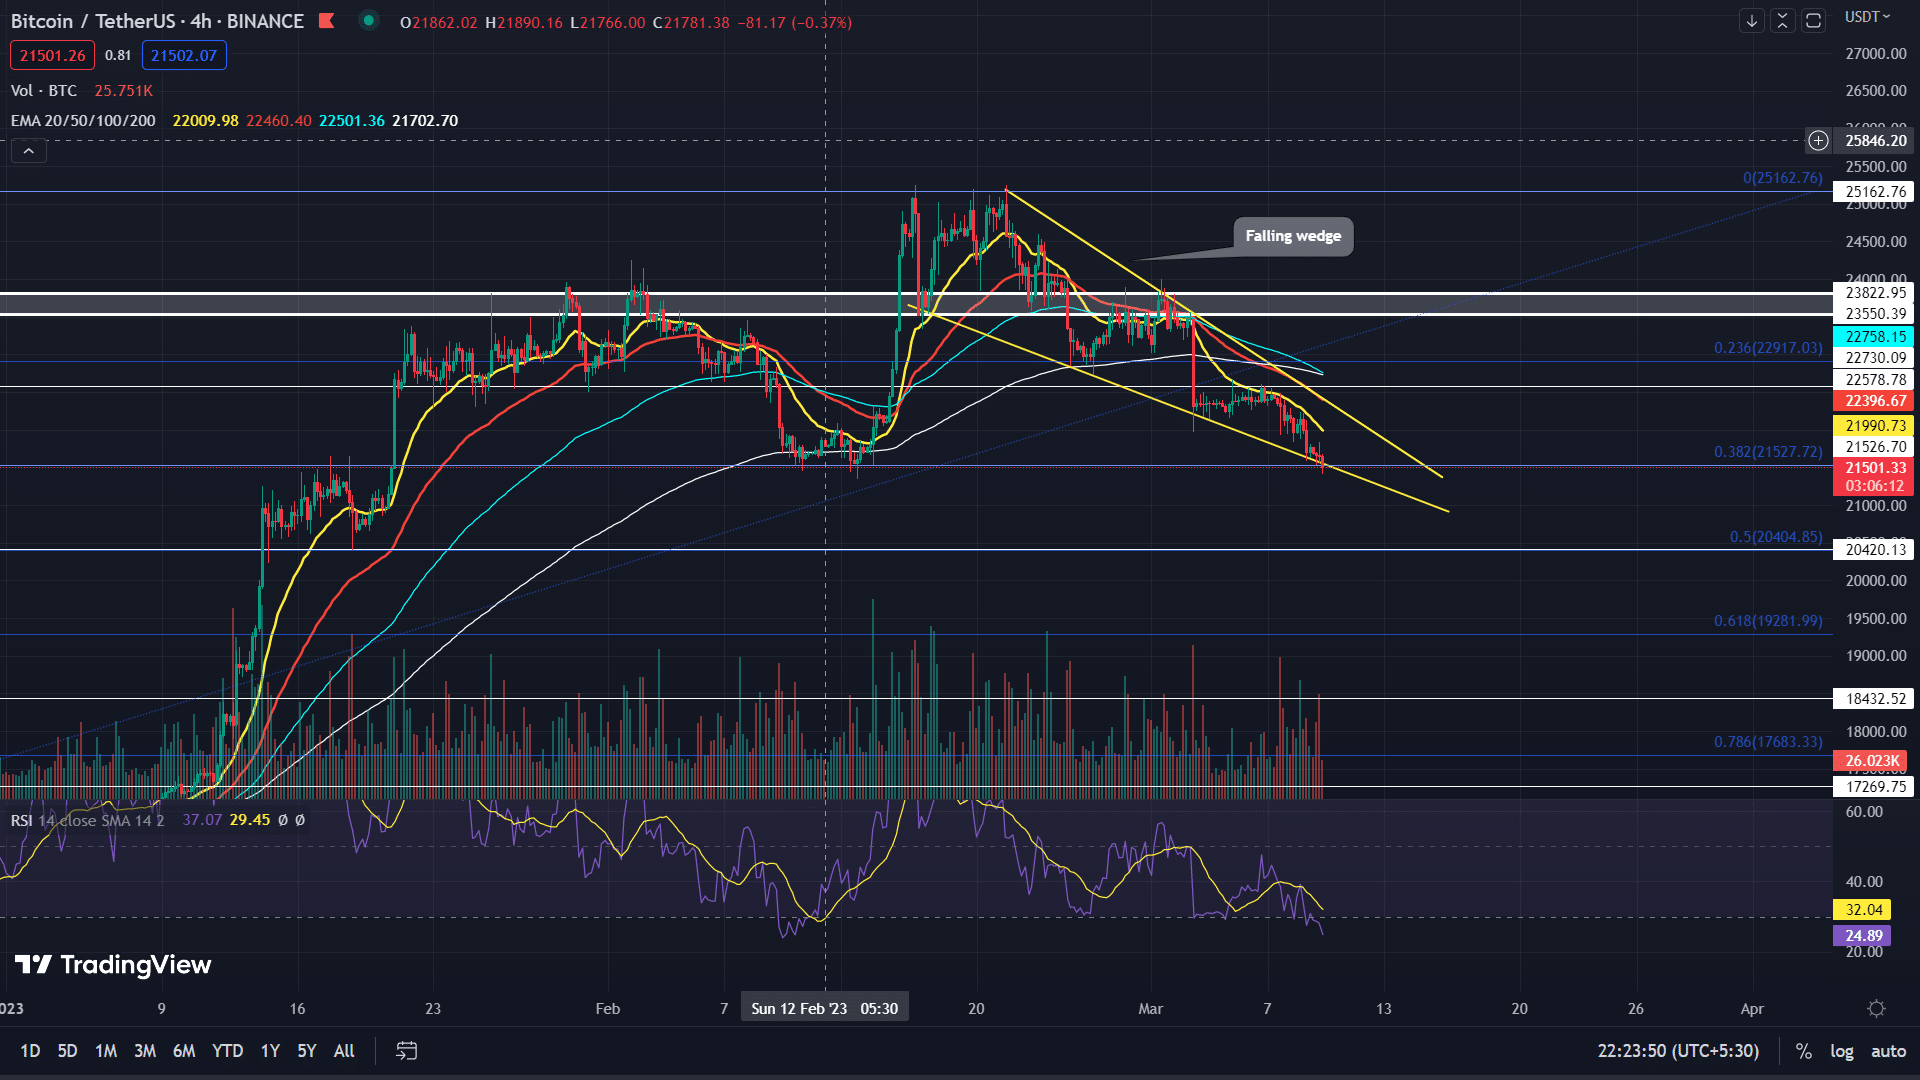
Source-Tradingview
The Bitcoin price has been in a correction phase for nearly three weeks now and has experienced a decline of 13.8% from the peak of $25200. This downfall has plunged the coin price to a combined support zone of 0.382 FIB and $21500 psychological level and the lower support trendline of a falling wedge pattern.
By the press time, the BTC price trades at $21636 and continues to hover above $21500 support. Usually, a retest to trendline support of the wedge pattern triggers a minor bullish pullback to hit the overhead trendline.
Trending Stories
Also Read: Top 10 Carbon Negative Cryptos For 2023
However, the interested buyer will need a breakout above the resistance trendline to obtain a long entry opportunity in Bitcoin. This breakout will signal the end of the ongoing correction phase and a higher possibility of uptrend continuation.
The post-breakout rally may soar the BTC price to the following targets of $22400, $23800, or $25000.
On a contrary note, a breakdown below the lower support trendline will invalidate the bullish thesis.
Technical indicator
RSI: despite the declining price action, the daily RSI slope moving sideways signals the weakening of bullish momentum. Thus bullish divergence may offer additional confirmation for a wedge pattern breakout.
advertisement
EMAs(4-hour chart)-: the 20-day EMA slope act as a dynamic resistance to Bitcoin price
Bitcoin Price Intraday Levels
- Spot rate: 21646
- Trend: Bearish
- Volatility: High
- Resistance levels- $22500 and $23800
- Support levels- $21500 and $20500
Share this article on:
advertisement
The presented content may include the personal opinion of the author and is subject to market condition. Do your market research before investing in cryptocurrencies. The author or the publication does not hold any responsibility for your personal financial loss.
<!– Close Story–>
- SEO Powered Content & PR Distribution. Get Amplified Today.
- Platoblockchain. Web3 Metaverse Intelligence. Knowledge Amplified. Access Here.
- Source: https://coingape.com/markets/btc-price-prediction-where-will-bitcoin-price-head-this-month-25k-or-18k/

