Join Our Telegram channel to stay up to date on breaking news coverage
The Band Protocol price prediction shows that BAND spikes upward because of a recent recovery above the moving averages.
Band Protocol Prediction Statistics Data:
- Band Protocol price now – $1.158
- Band Protocol market cap – $153.2 million
- Band Protocol circulating supply – 134.4 million
- Band Protocol total supply – 138.8 million
- Band Protocol Coinmarketcap ranking – #159
BAND/USD Market
Key Levels:
Resistance levels: $1.35, $1.40, $1.45
Support levels: $0.90, $0.80, $0.70
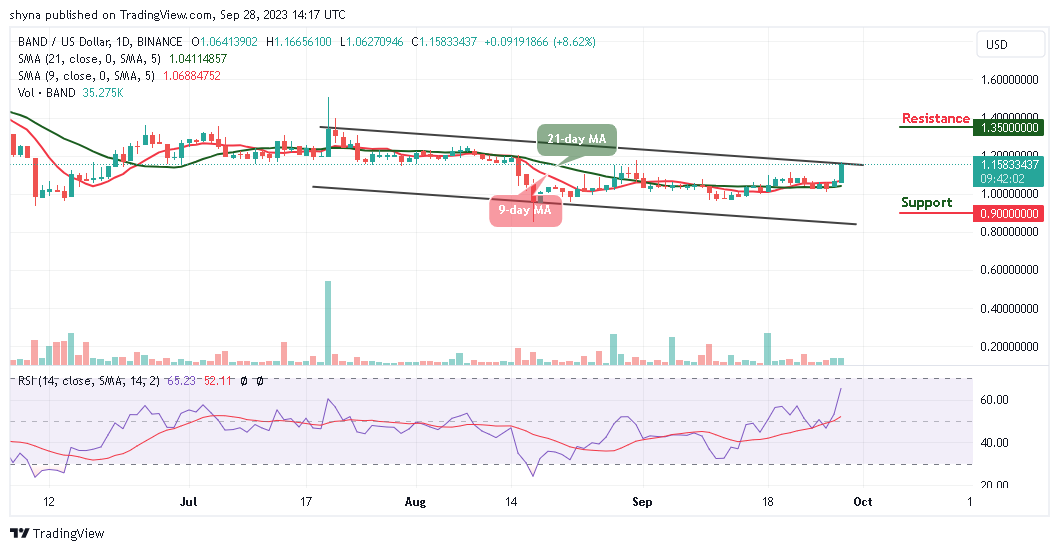
BAND/USD is ranging as the coin moves above the 9-day and 21-day moving averages trading around $0.158. Meanwhile, the Band Protocol price could maintain the upward movement if the buyers increase the pressure.
Band Protocol Price Prediction: Can BAND Decline Below $1.00 Level
The Band Protocol price is moving sideways, and with all indications, the coin is likely to follow the uptrend if it crosses below the upper boundary of the channel. However, the red line of the 9-day MA is above the green line of the 21-day moving average which could confirm the upward movement. Meanwhile, any bearish movement toward the lower boundary of the channel may hit the supports at $0.90, $0.80, and $0.70.
However, if the Band Protocol price continues with the bullish movement, it is likely to hit the nearest resistance at $1.20 and any further bullish movement above this level may locate the next resistance levels at $1.35, $1.40, and $1.50. Similarly, the technical indicator Relative Strength Index (14) is moving to cross into the overbought region, suggesting that more bullish signals may come to play out.
BAND/BTC Heads to the North
Against Bitcoin, the Band Protocol price is moving sideways as the coin trades at 4347 SAT above the 9-day and 21-day moving averages. Looking at the daily chart, if the coin can make a cross above the upper boundary of the channel, it could reach the nearest resistance level at 4500 SAT. On the contrary, if the market drops below the current market value, the next key support may come at 3600 SAT and below.
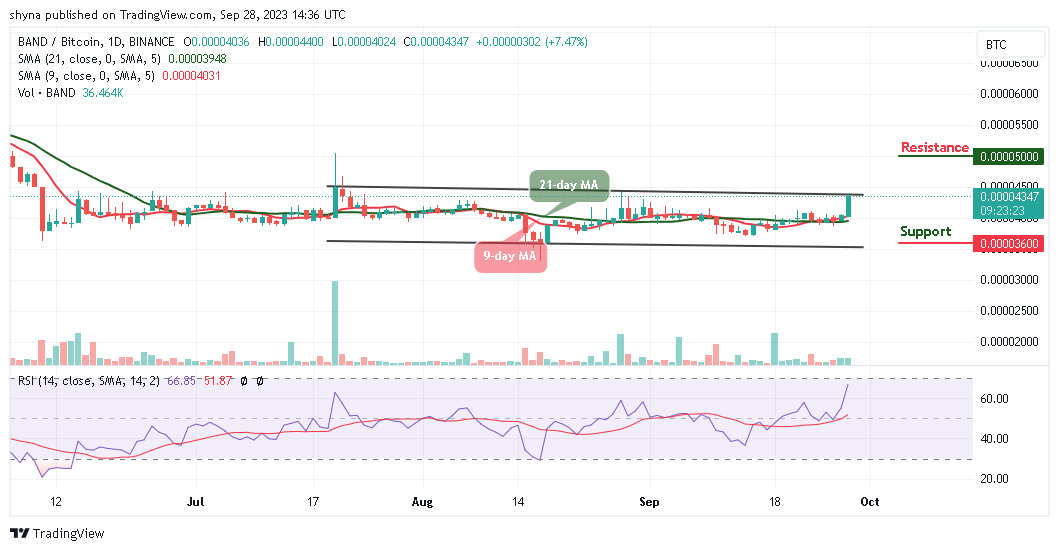
On the bullish side, a possible rise could push the market above the channel which could hit the resistance level of 5000 SAT and above. As revealed by the technical indicator, the Relative Strength Index (14) is moving bullishly as the signal line moves to cross above the 70 level.
Band Protocol Alternatives
At the time of writing, the Band Protocol price faces the upside as the coin keeps moving above the 9-day and 21-day moving averages. However, the technical indicator Relative Strength Index (14) is likely to cross above the 70-level, and there is a higher probability that the BAND price may locate the resistance level of $1.20.
Meanwhile, Bitcoin Minetrix is your ticket to a secure and prosperous future in the world of Bitcoin mining. Our revolutionary tokenized cloud mining platform is reshaping the industry by putting mining power in the hands of everyday investors. You can trust us for a secure and transparent experience. Seize this moment to invest, as almost $164k has been raised in the presale.
Earn Free Crypto – Bitcoin Minetrix

- Cloud Mining Made Easy
- Early Access Presale Live Now
- High APY Staking
Join Our Telegram channel to stay up to date on breaking news coverage
- SEO Powered Content & PR Distribution. Get Amplified Today.
- PlatoData.Network Vertical Generative Ai. Empower Yourself. Access Here.
- PlatoAiStream. Web3 Intelligence. Knowledge Amplified. Access Here.
- PlatoESG. Carbon, CleanTech, Energy, Environment, Solar, Waste Management. Access Here.
- PlatoHealth. Biotech and Clinical Trials Intelligence. Access Here.
- Source: https://insidebitcoins.com/news/band-protocol-price-prediction-for-today-september-28-band-technical-analysis

