Published 1 hour ago
ADA price Prediction: A sustained rally in Cardano price has breached several minor resistance levels since last month, acting as a stepping stone for crypto buyers. Thus, as the bull trend continues the coin price recently offered another breakout opportunity from the $0.38 barrier. The prices retesting the breached resistance with the formation of a morning star candle pattern indicated that altcoin possesses a higher possibility to prolong the ongoing recovery.
advertisement
Key Points:
- The Cardano price may face intense supply pressure at the $0.427 mark.
- The formation of a famous bullish reversal pattern called inverted head and shoulder prepares ADA price for a significant uptrend above $0.427
- The intraday trading volume in the ADA coin is $198.2 Million, indicating a 2.23% loss
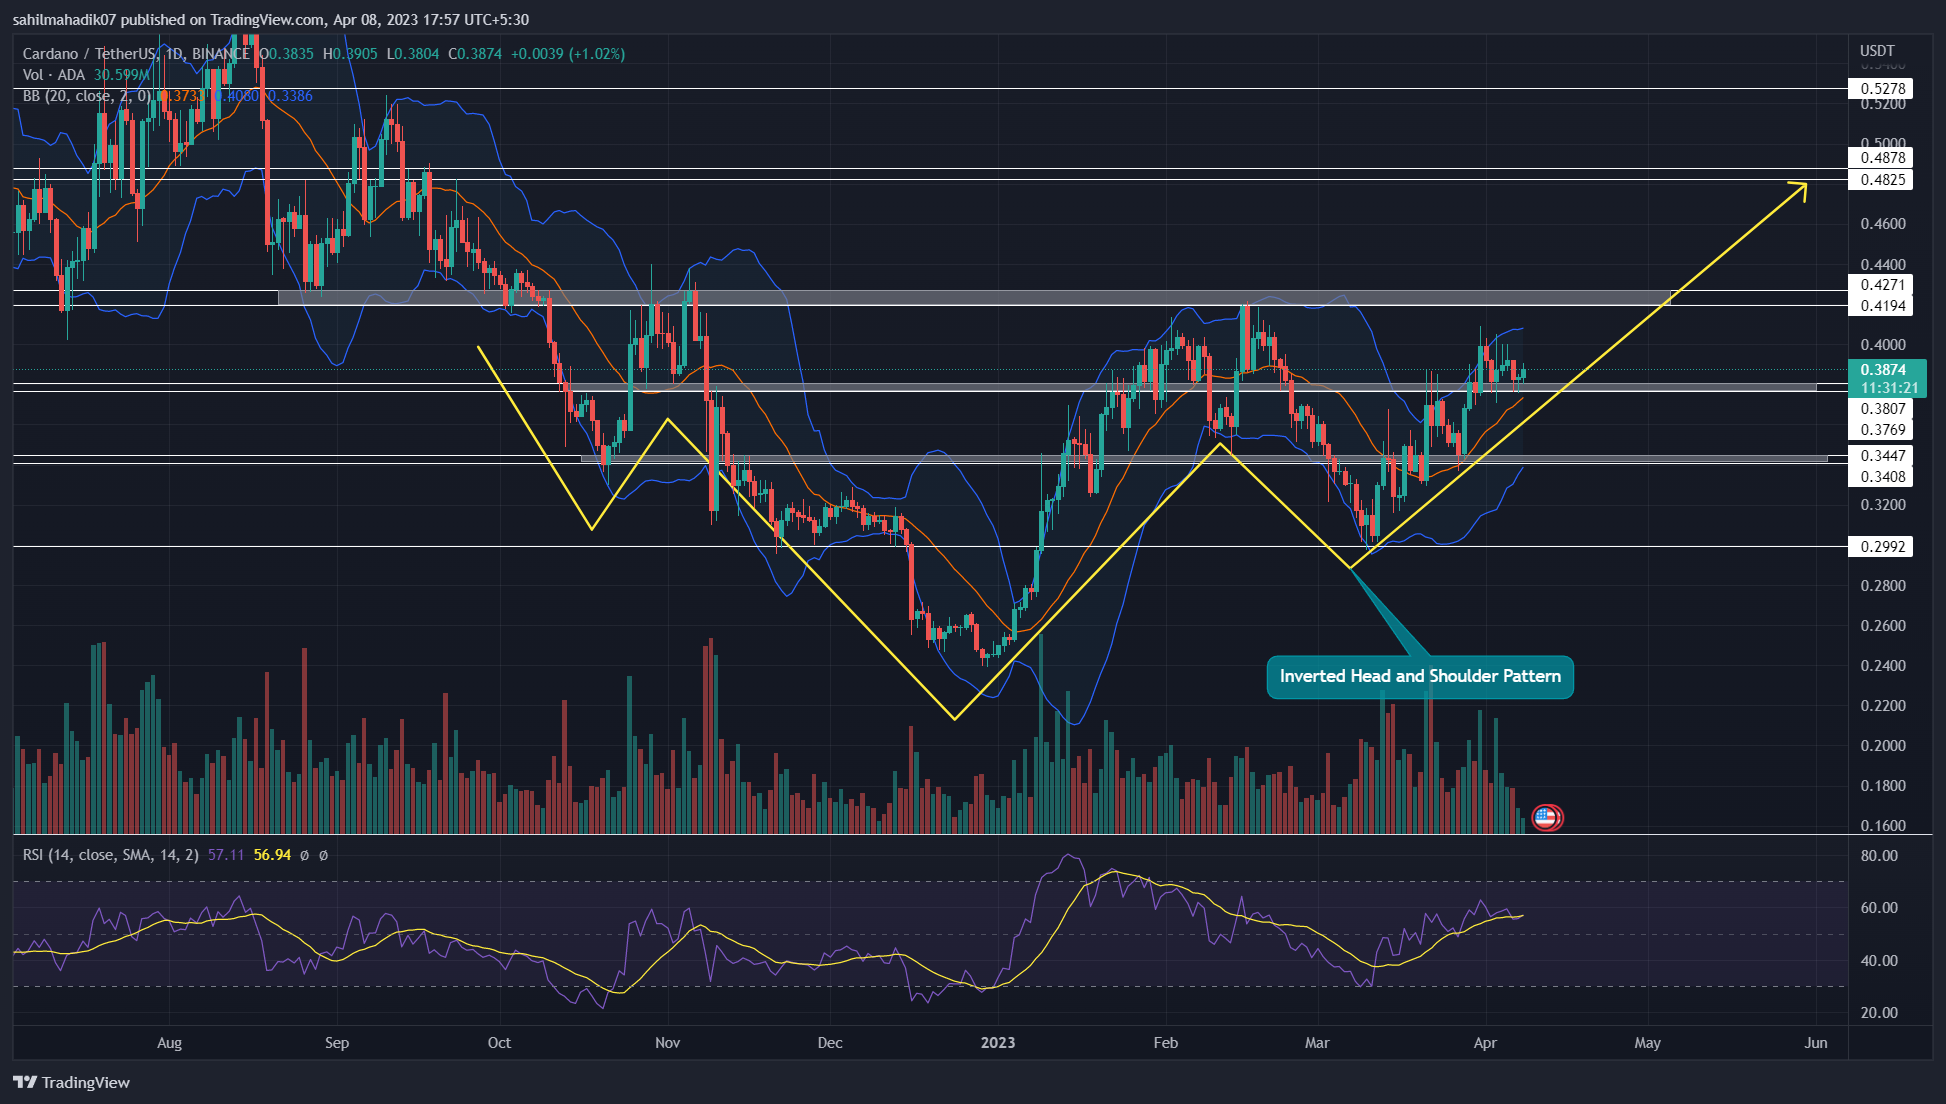
Source- Tradingview
On March 31st, the rising Cardano coin price gave a bullish breakout from a horizontal resistance of $0.38-$0.377. This breakout is a sign that buyers are confident about reaching higher despite the growing FUD in the market.
Since last week, the coin price hovering between the $0.38 breached resistance, providing buyers a new launchpad to bounce off to higher levels. The lower price rejection at the aforementioned level sign of increasing demand pressure as sidelined buyers enter the market.
Trending Stories
Also Read: What Is Regenerative Finance (Refi) And Who Is It For?
Thus, with sustained buying the ADA price will likely increase by 10% and hit the $0.427-$0.42 multiple-month resistance. Furthermore, the mentioned resistance is also the neckline resistance of a famous bullish reversal pattern called the inverted head and shoulder pattern.
Therefore, a potential breakout from $0.427 would be an early sign of a trend change.
Technical Indicator
Relative Strength Index: Similar to price action, the daily RSI slope which reflects the current strength of the ongoing trend is gradually rising to the higher level of bullish territory. This growth signals a sustained buying activity in Cardano.
Bollinger Band: The long traders can use the midline of the Bollinger Band indicator as a key support to indicate the recovery rally will continue. Thus, a breakdown from it will signal for price reversal.
Cardano Coin Price Intraday Levels
- Spot price: $0.389
- Trend: Bullish
- Volatility: Low
- Resistance level- $0.42 and $0.48
- Support level- $0.38-0.377 and $0.3
Share this article on:
advertisement
The presented content may include the personal opinion of the author and is subject to market condition. Do your market research before investing in cryptocurrencies. The author or the publication does not hold any responsibility for your personal financial loss.
<!– Close Story–>
- SEO Powered Content & PR Distribution. Get Amplified Today.
- Platoblockchain. Web3 Metaverse Intelligence. Knowledge Amplified. Access Here.
- Source: https://coingape.com/markets/ada-price-prediction-demand-pressure-at-support-sets-cardano-price-for-10-jump/

