
Earn Your First Bitcoin Sign up and get $12 Bonus Referral bonus up to $3,000
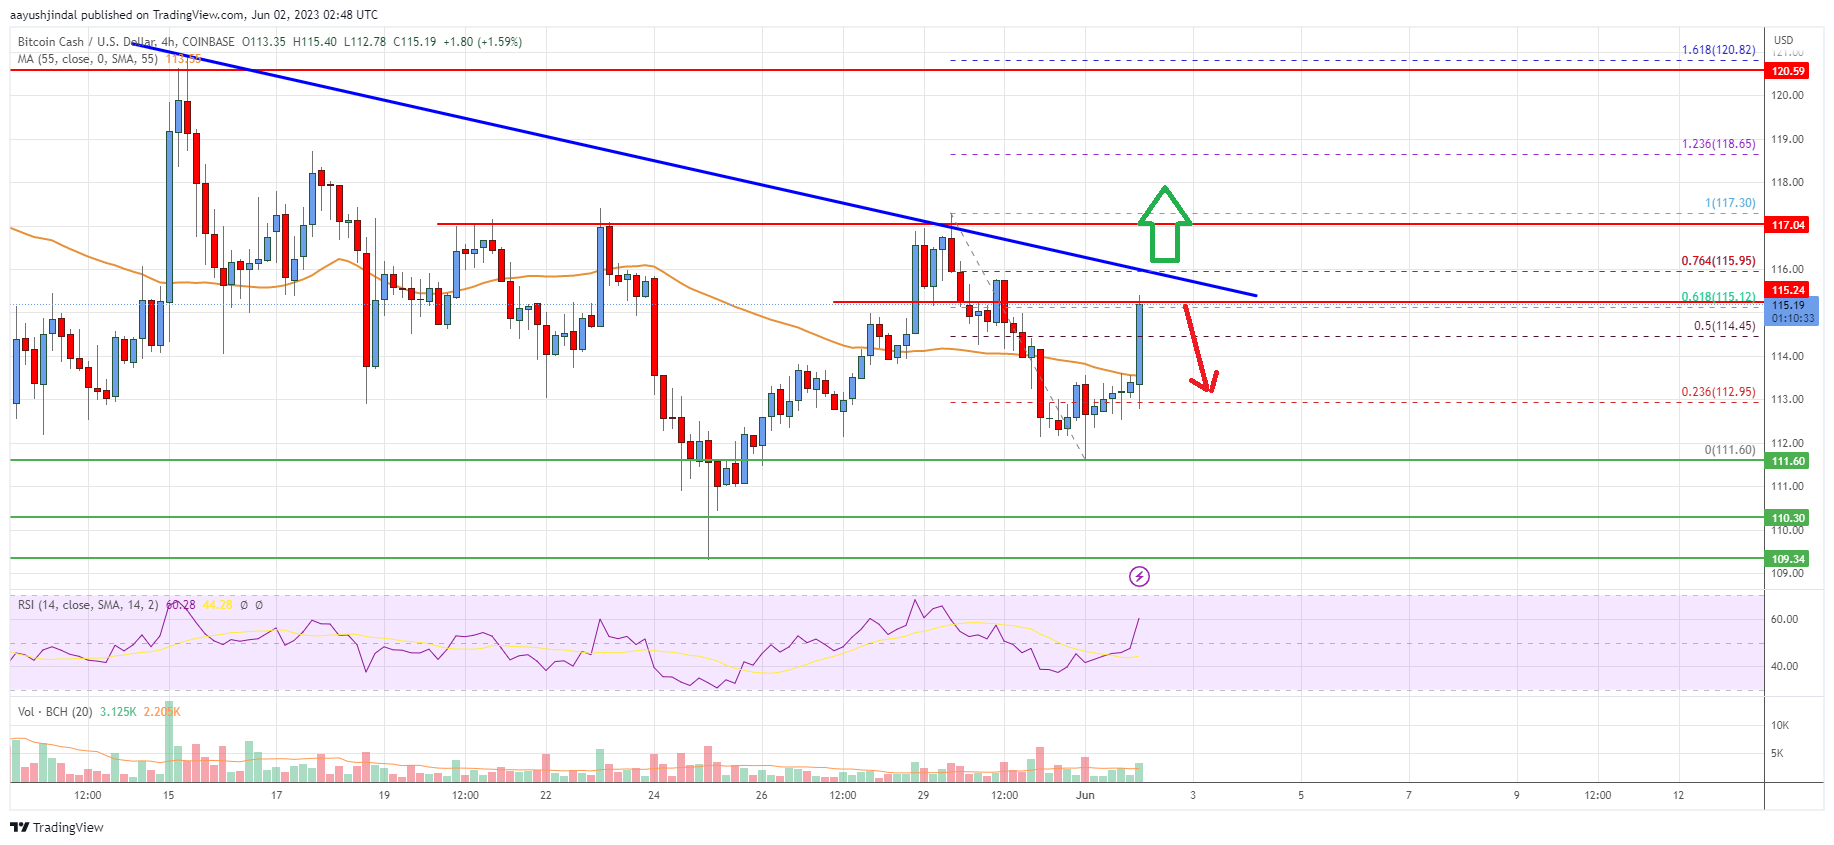
- Bitcoin cash is attempting a recovery wave above the $112 resistance against the US Dollar.
- The price is now trading above the $114 zone and the 55 simple moving average (4 hours).
- There is a key bearish trend line forming with resistance near $116 on the 4-hour chart of the BCH/USD pair (data feed from Coinbase).
- The pair must clear $116 and $118 to start a steady upward movement in the near term.
Bitcoin cash price is rising above $114 against the US Dollar, similar to Bitcoin. BCH/USD could start a fresh surge if it clears the $118 level.
Bitcoin Cash Price Analysis
Bitcoin cash price formed a decent support base above the $110 level. BCH started a decent increase and was able to clear the $112 resistance zone.
The price climbed above the $114 resistance level. There was a move above the 50% Fib retracement level of the downward move from the $117.30 swing high to the $111.60 low. It is now trading above the $114 zone and the 55 simple moving average (4 hours).
On the upside, the price is facing resistance near the $116 level. There is also a key bearish trend line forming with resistance near $116 on the 4-hour chart of the BCH/USD pair.
The trend line is near the 76.4% Fib retracement level of the downward move from the $117.30 swing high to the $111.60 low. The next major resistance is near the $118 level, above which the price may perhaps rise toward the $120 level. Any more gains above $120 could set the pace for a move toward the $126 level.
If not, the price might decline again. Immediate support on the downside is near the $113 level. The first major support sits near the $112 level. The next major support is near $110, below which the bears might aim for $102. The next target for them may perhaps be near the $100 level.
Bitcoin Cash Price
Looking at the chart, Bitcoin Cash’s price is now trading above the $114 zone and the 55 simple moving average (4 hours). Overall, the price must clear $116 and $118 to continue higher in the near term.
Technical indicators
4 hours MACD – The MACD for BCH/USD is gaining pace in the bullish zone.
4 hours RSI (Relative Strength Index) – The RSI for BCH/USD is above the 50 level.
Key Support Levels – $113 and $110.
Key Resistance Levels – $116 and $118.
- SEO Powered Content & PR Distribution. Get Amplified Today.
- PlatoAiStream. Web3 Data Intelligence. Knowledge Amplified. Access Here.
- Minting the Future w Adryenn Ashley. Access Here.
- Buy and Sell Shares in PRE-IPO Companies with PREIPO®. Access Here.
- Source: https://www.livebitcoinnews.com/bitcoin-cash-analysis-key-breakout-resistance-sits-at-118/

