Published 14 hours ago
XRP Price Analysis: Over the past five weeks, the XRP coin price has witnessed a steep correction in which the price tumbled from a high of $0.585 to the current price of $0.45 recording a 20% loss. However, it seems the retracement phase is precisely resonating between two downsloping trendlines projecting the formation of a flag pattern. This famous chart pattern is often spotted between established uptrends offering an excellent long-entry opportunity to interested traders.
advertisement
Key Points:
- The decreasing volume activity indicates the ongoing correction is temporary
- A breakout above the overhead resistance trendline will signal the end of this retracement phase
- The intraday trading volume in the XRP is $393.5 Million, indicating a 43% loss.
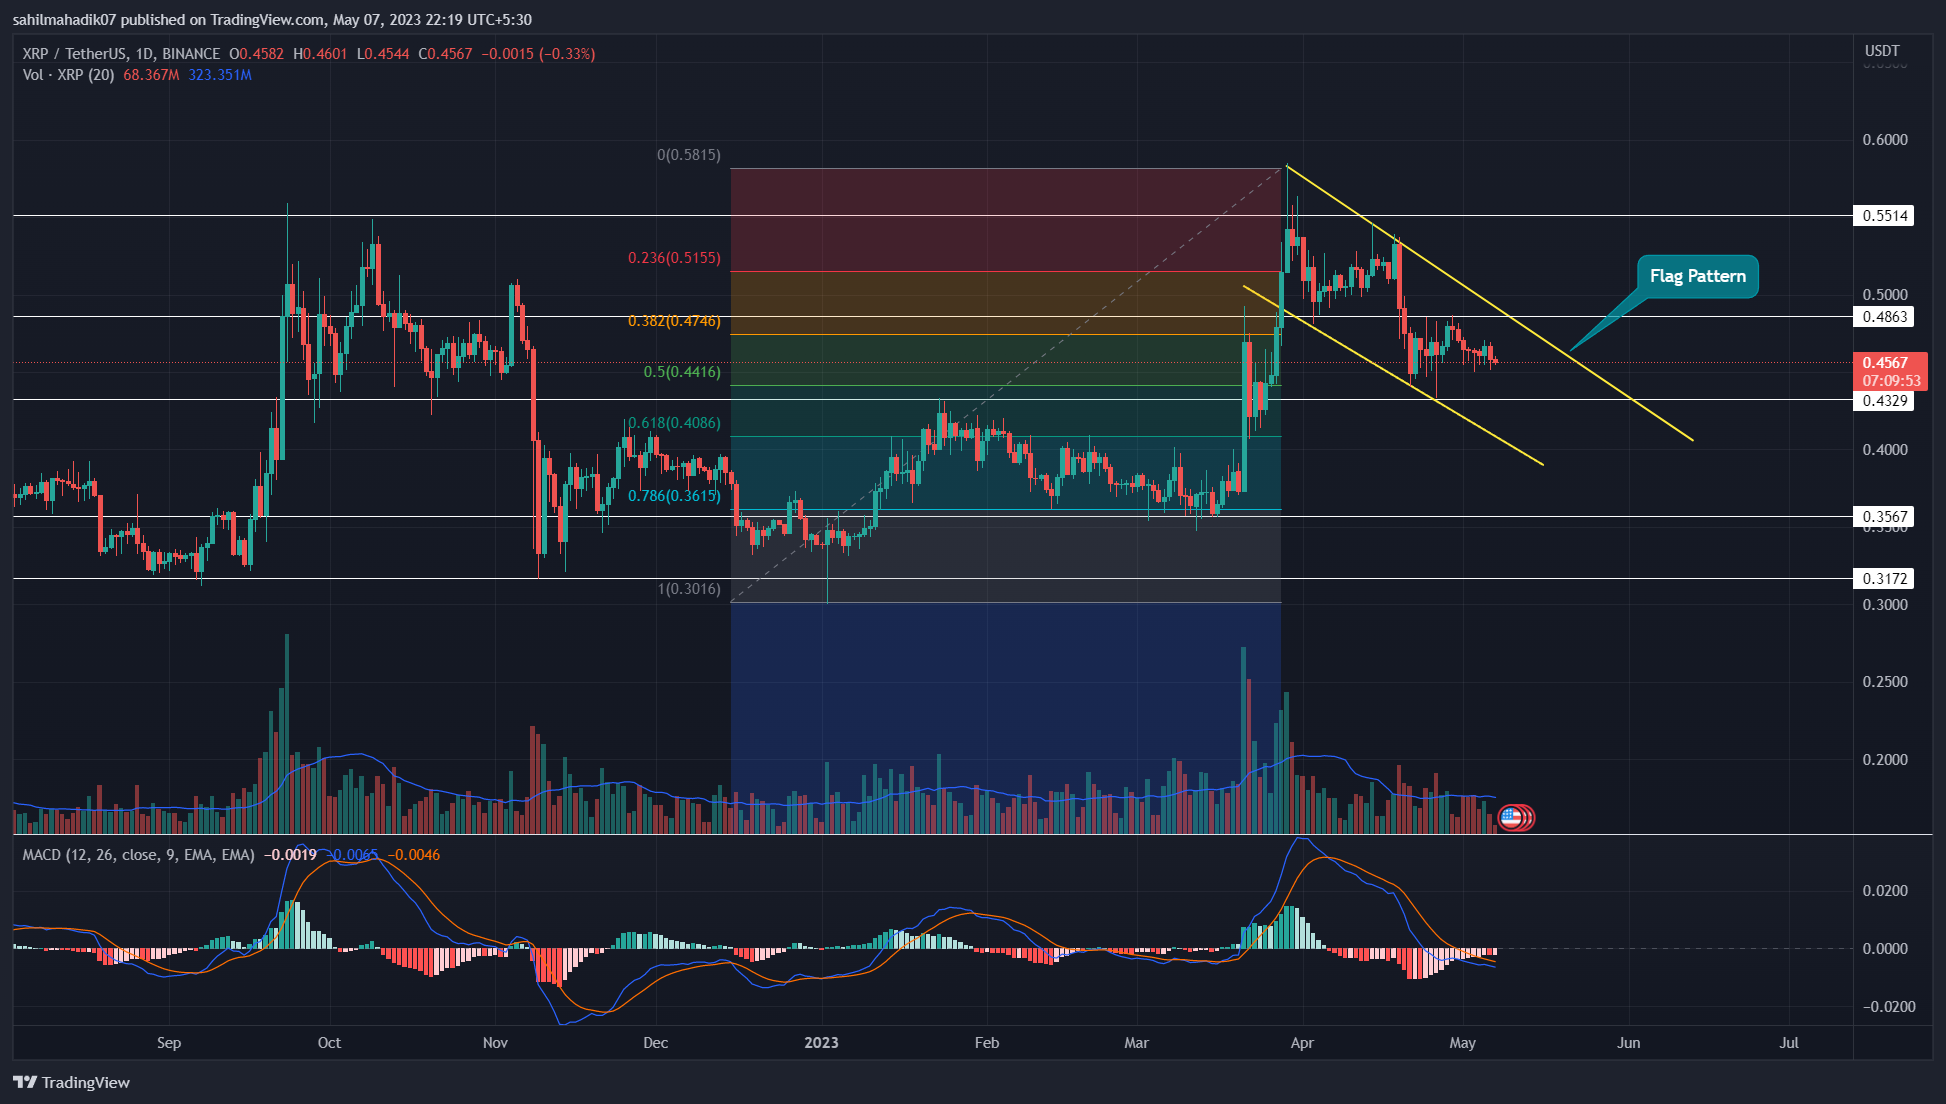
Source- Tradingview
Amid the ongoing uncertainty in the crypto market, the falling XRP price took a temporary sideways turn and resonated between the $0.486 and $0.43 horizontal levels. The cluster of daily candles in a short space reflects the indecisiveness among market participants.
If the coin price continues to move sideways it would hit the pattern’s resistance trendline which may recuperate the selling momentum. Until the overhead trendline is intact, the XRP price will prolong the correction phase to lower levels.
Trending Stories
However, under the influence of the flag pattern, the XRP price is more likely to breach the resistance trendline and flip it into potential support. This breakout will offer an entry opportunity to new buyers and may drive the prices up 20% to rechallenge the $0.55 barrier.
Technical Indicator
Fibonacci Retracement Indicator: The XRP price correction still hovering above the 50% Fibonacci retracement level indicates the overall market trend remains bullish
Moving Average Convergence/Divergence: the MACD(blue) and signal(orange) line moving sideways hints weakening of bearish momentum.
XRP Intraday Price Levels
- Spot price: $0.45
- Trend: Sideways
- Volatility: High
- Resistance level- $0.485 and $0.56
- Support level- $0.44 and $0.4
Share this article on:
advertisement
The presented content may include the personal opinion of the author and is subject to market condition. Do your market research before investing in cryptocurrencies. The author or the publication does not hold any responsibility for your personal financial loss.
<!– Close Story–>
- SEO Powered Content & PR Distribution. Get Amplified Today.
- PlatoAiStream. Web3 Data Intelligence. Knowledge Amplified. Access Here.
- Minting the Future w Adryenn Ashley. Access Here.
- Buy and Sell Shares in PRE-IPO Companies with PREIPO®. Access Here.
- Source: https://coingape.com/markets/xrp-price-analysis-this-pattern-restart-a-recovery-in-xrp-price-back-to-0-55/

