SNEAK PEEK
- XRP’s price surge sparks investor interest, but recent drop tests resilience.
- Bearish market conditions impact XRP’s price and trading volume.
- Growing address activity indicates long-term promise for XRP.
The surge in XRP Network’s price and address activity has caught the attention of many crypto enthusiasts. As the sixth-ranked market cap asset, XRP is a top contender in the crypto world. The past 19 days have seen an impressive 22% jump in prices, which is a testament to the growing interest in this asset. With historically high address activity surges, it’s clear that XRP is becoming increasingly popular among investors.
🗣️ #XRPNetwork is the top trending asset in #crypto as prices have jumped +22% the past 19 days. We are also seeing historically high address activity surges for the 6th ranked market cap asset. Expect $XRP‘s price to behave uniquely for the time being. https://t.co/xfW9vOGXcC pic.twitter.com/WYNbPkkJFd
— Santiment (@santimentfeed) May 31, 2023
However, the XRP market dropped sharply during the past 24 hours, and attempts to recover were fruitless as the intraday high of $0.5197 was a strong resistance level. The bears successfully decreased the price of XRP during the slide from its peak to an intraday low of $0.5025, where it found support. Bearish market conditions persisted as of the time of writing, causing the price of XRP to drop by 1.82% to $0.5057 from the previous close.
XRP’s market capitalization decreased by 1.91% to $26,288,693,979, and the 24-hour trading volume decreased by 33.50% to $1,450,254,763. This decline can be attributed to investors ignorance and anxiety as they watch the market carefully and postpone making significant investments until they see a recovery.
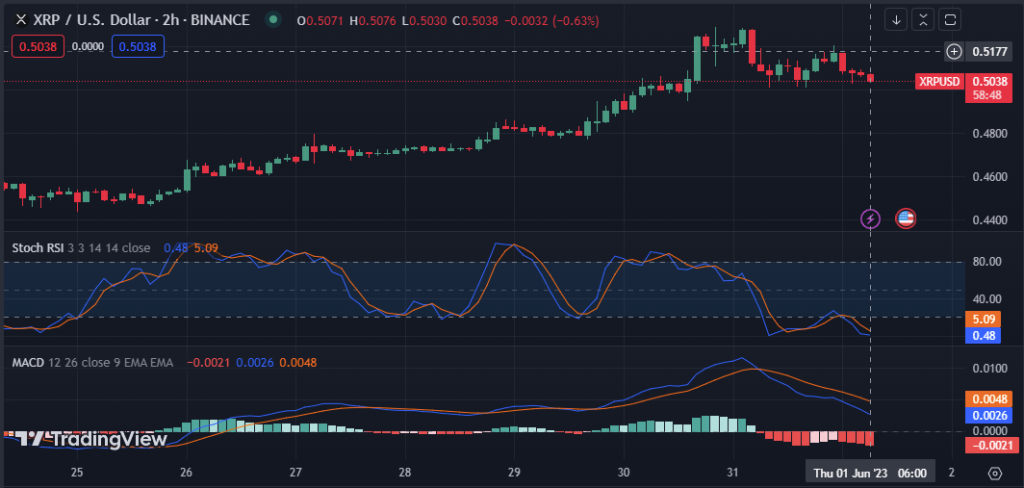
On the 2-hour price chart for the XRP market, the MACD blue line is below the signal line and in the negative region with a reading of -0.0021. Investors may want to think about selling their XRP tokens or holding off till the price may drop before repurchasing them because this move implies a pessimistic trend in the market.
The stochastic RSI reading of 0.48 and movement below the signal line on the 2-hour price chart for XRP suggest that the stock is oversold and may make a short-term recovery. However, this may be a relief rally rather than reversing the long-term trend, so traders should be cautious.
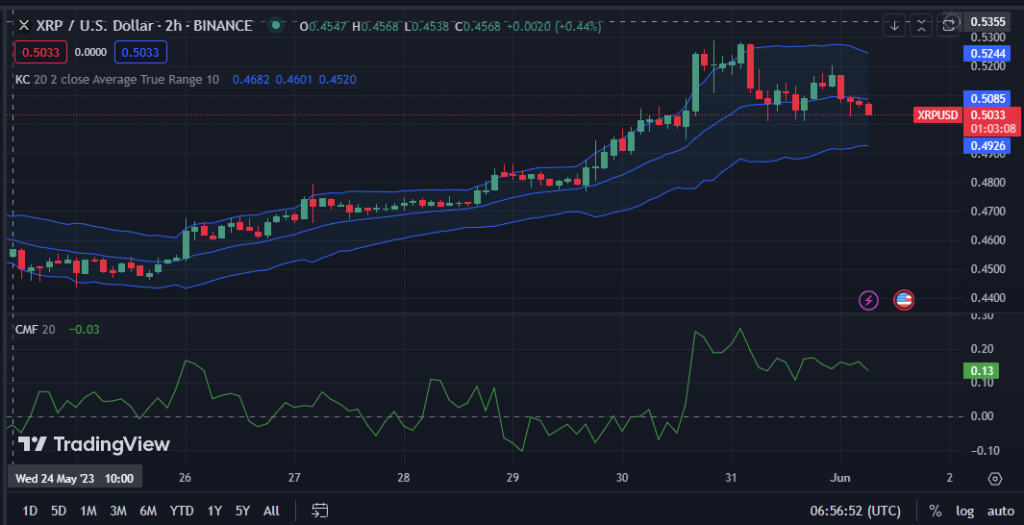
The top and bottom bars of the Keltner Channel bands have readings of 0.5244 and 0.4926, respectively, on the XRP’s price chart. This pattern shows that the price of XRP may drop further and soon test the lower support level.
The price action movement, which forms red candlesticks towards the bottom band, supports this point of view. A reversal or recovery could happen if the price movement keeps going in this direction and breaks the lower band, which indicates that the market is oversold.
On XRP’s price chart, the Chaikin Money Flow (CMF) value of 0.13 indicates more selling pressure than buying demand. This level shows that investors are selling XRP more than they are buying it, which could result in more price reductions if the trend persists.
In conclusion, XRP faces short-term challenges as bears dominate the market, but the growing address activity and investor interest highlight its long-term potential.
Disclaimer: Cryptocurrency price is highly speculative and volatile and should not be considered financial advice. Past and current performance is not indicative of future results. Always research and consult with a financial advisor before making investment decisions
- SEO Powered Content & PR Distribution. Get Amplified Today.
- PlatoAiStream. Web3 Data Intelligence. Knowledge Amplified. Access Here.
- Minting the Future w Adryenn Ashley. Access Here.
- Buy and Sell Shares in PRE-IPO Companies with PREIPO®. Access Here.
- Source: https://investorbites.com/xrp-price-analysis-01-06/

