Crypto analyst Jaydee recently took to X (formerly Twitter), sharing another intriguing chart of XRP. The analyst presented the 2-month XRP dominance chart spanning from 2014 till today, shedding light on the cryptocurrency’s historical and potential future price actions. This examination brings to focus a falling trend line and a horizontal resistance line, which showcases a critical XRP dominance level at 2.62% that could be key for the price’s next parabolic move.
XRP Dominance Sits Just Below Key Level
Delving into the historical performance, the chart showcases moments when the token experienced rapid increases and furious drops in terms of crypto market dominance. There was a period where XRP underwent a staggering 39x price jump, reaching $0.39 in just 56 days in 2017. Shortly after, another surge saw the digital asset climb 17x within 28 days, marking its value at $3.31.
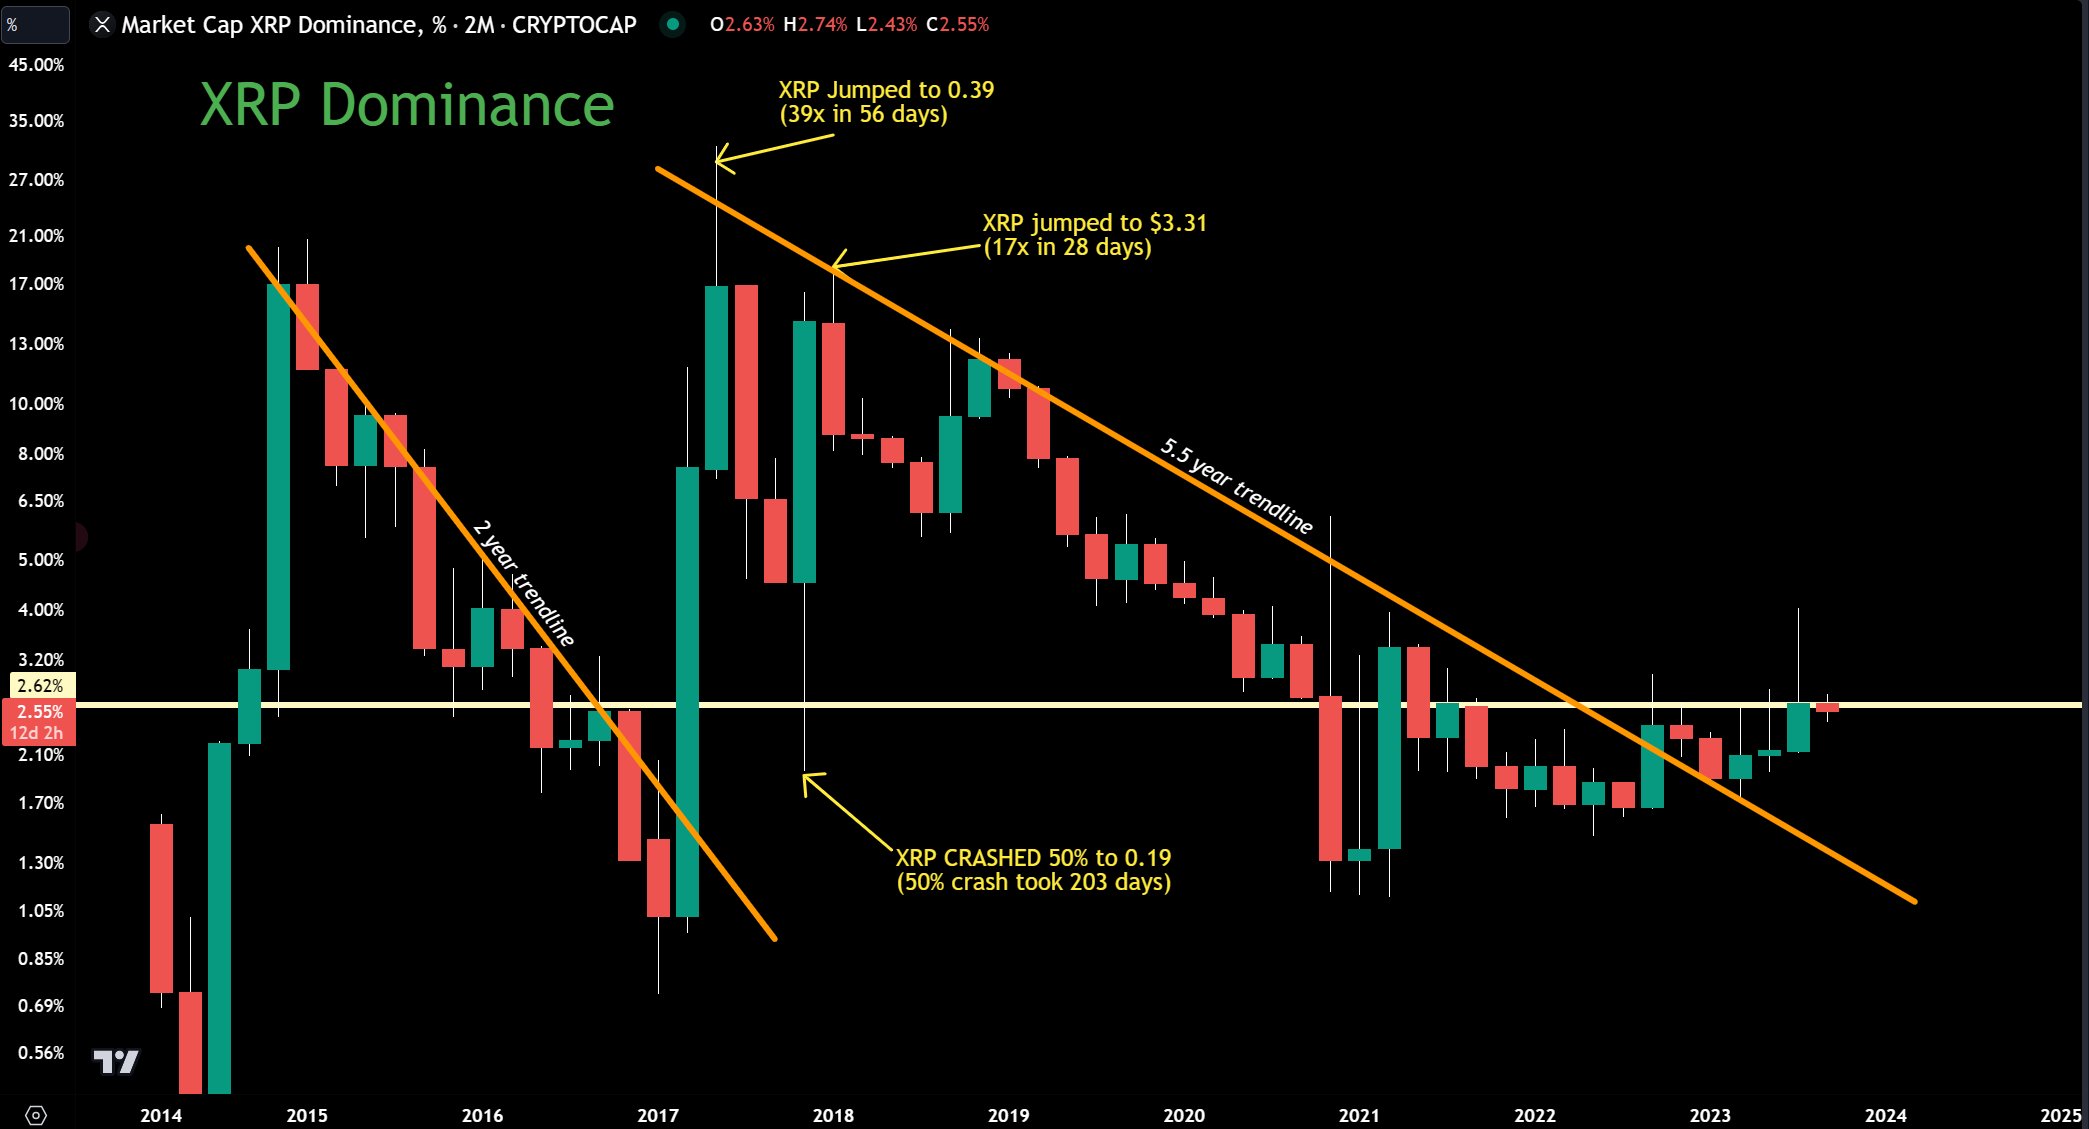
Both times, the dominance was rejected at the yellow 5.5-year trend line. This resistance line has consistently acted as a major barrier to XRP’s dominance in the crypto market. Every approach or touch of this line led to significant price actions toward the downside.
Remarkably, the cryptocurrency’s price experienced a similar situation from 2015 to 2017 when the dominance was also held below a falling trend line for more than two years. However, the breakout of this trend signaled a massive price surge as XRP dominance rose from merely 1% to above 30% in just four months in 2017.
Fast-forward to today, the cryptocurrency could be in a similar situation as in 2017. It has breached the trend and is moving beyond the red trend line. However, instead of an instant surge as in 2017, XRP’s dominance now contends with the pivotal 2.62% mark.
According to the analyst’s chart, it’s currently at 2.55%, narrowly missing the critical level. Notably, over the past 14 months, dominance hasn’t achieved a close above 2.62% on the bi-monthly chart. However, if it does surpass this threshold, it might signal the onset of the next parabolic ascent, as outlined by Jaydee.
Currently hitting the yellow resistance line. If we can have a full 2-month candle close above the yellow resistance line, expect the next parabolic move! Is 2024 the year?
Weekly Chart: When ‘Moon’?
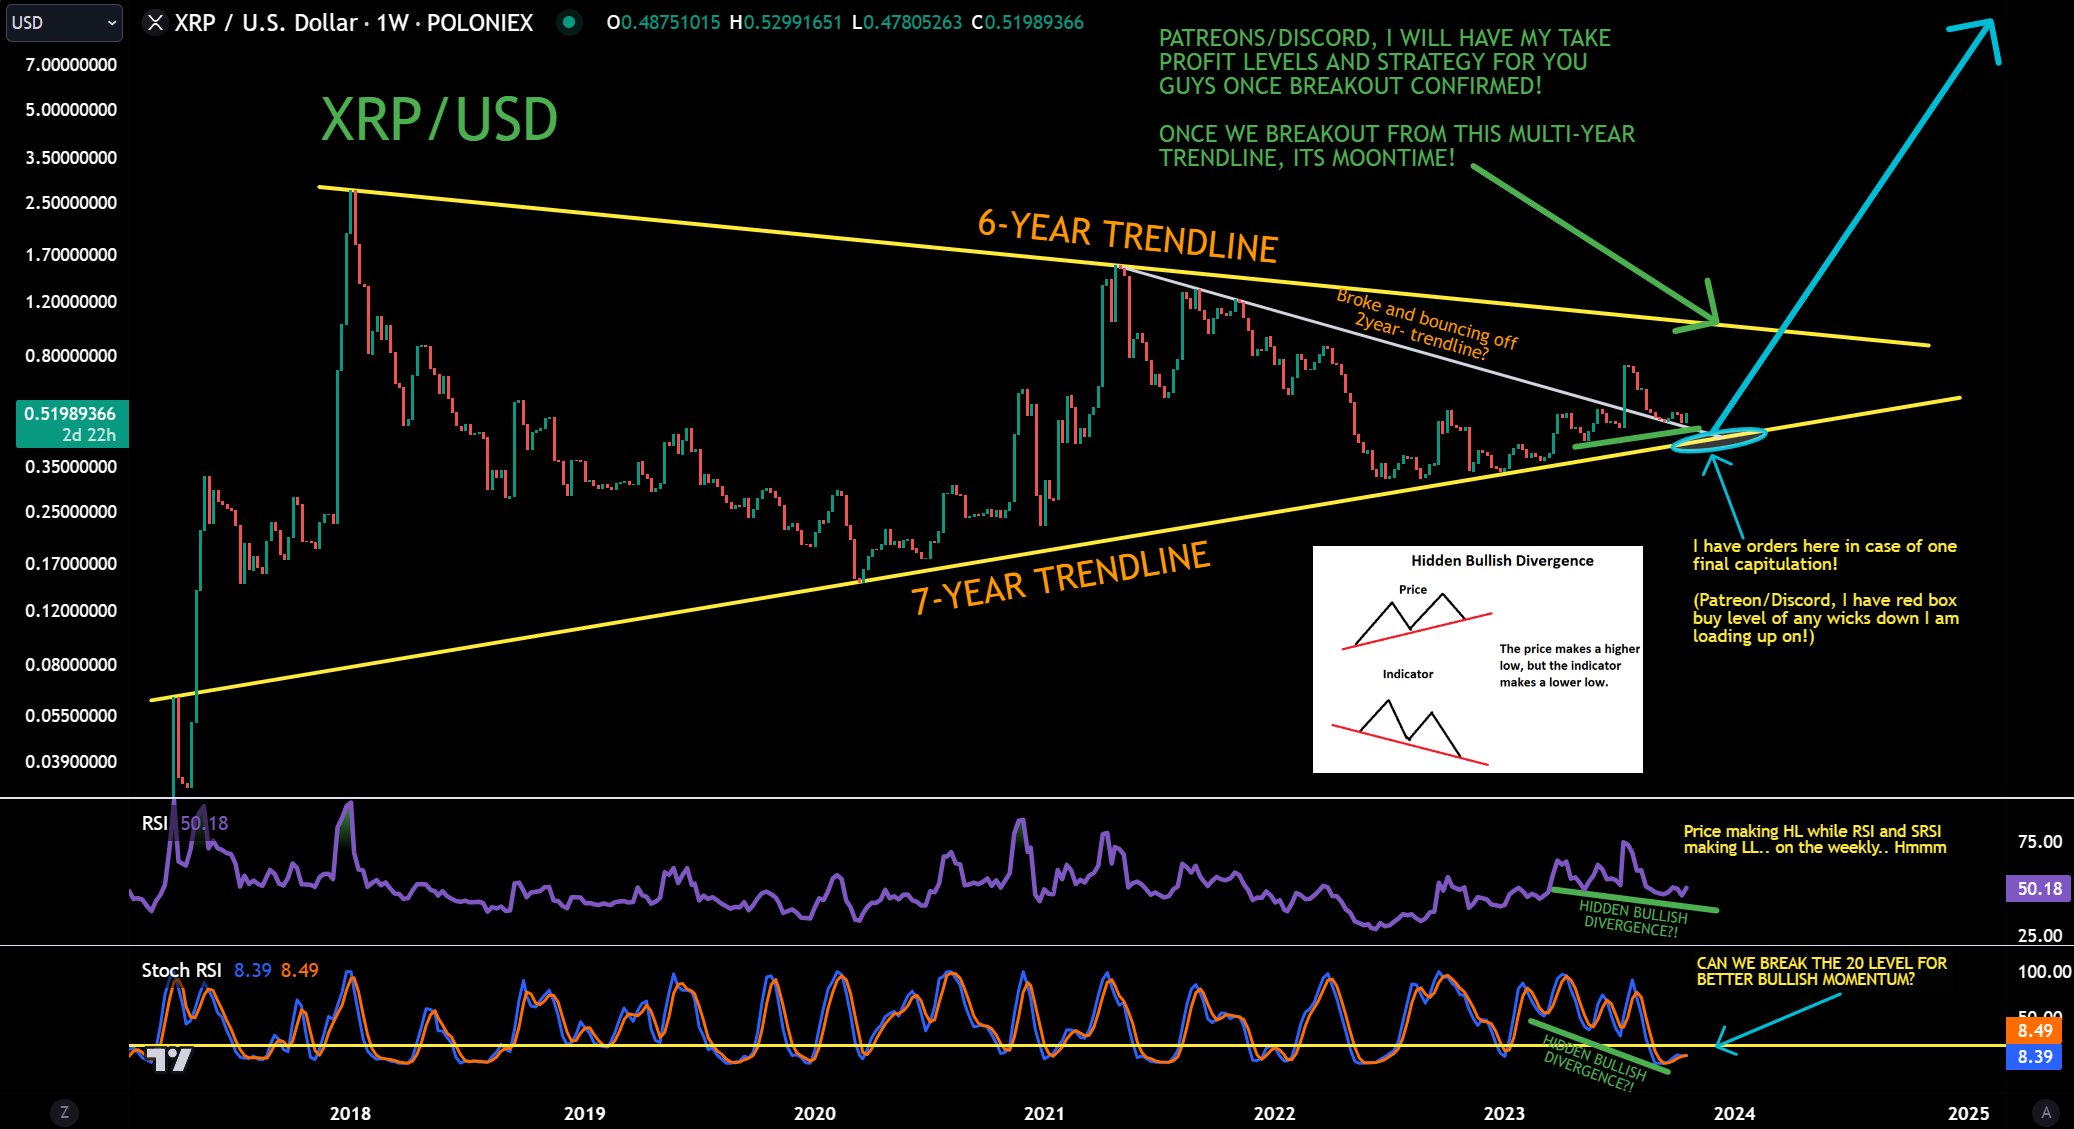
Jaydee shared another chart on X (formerly Twitter) today, stating with regards to the weekly XRP/USD chart: “Still creating higher high (HH) in Price while lower low (LL) in RSI and SRSI on the WEEKLY, while bouncing off the 2-year trend line.” From this, he discerns three key takeaways before XRP can “moon.”
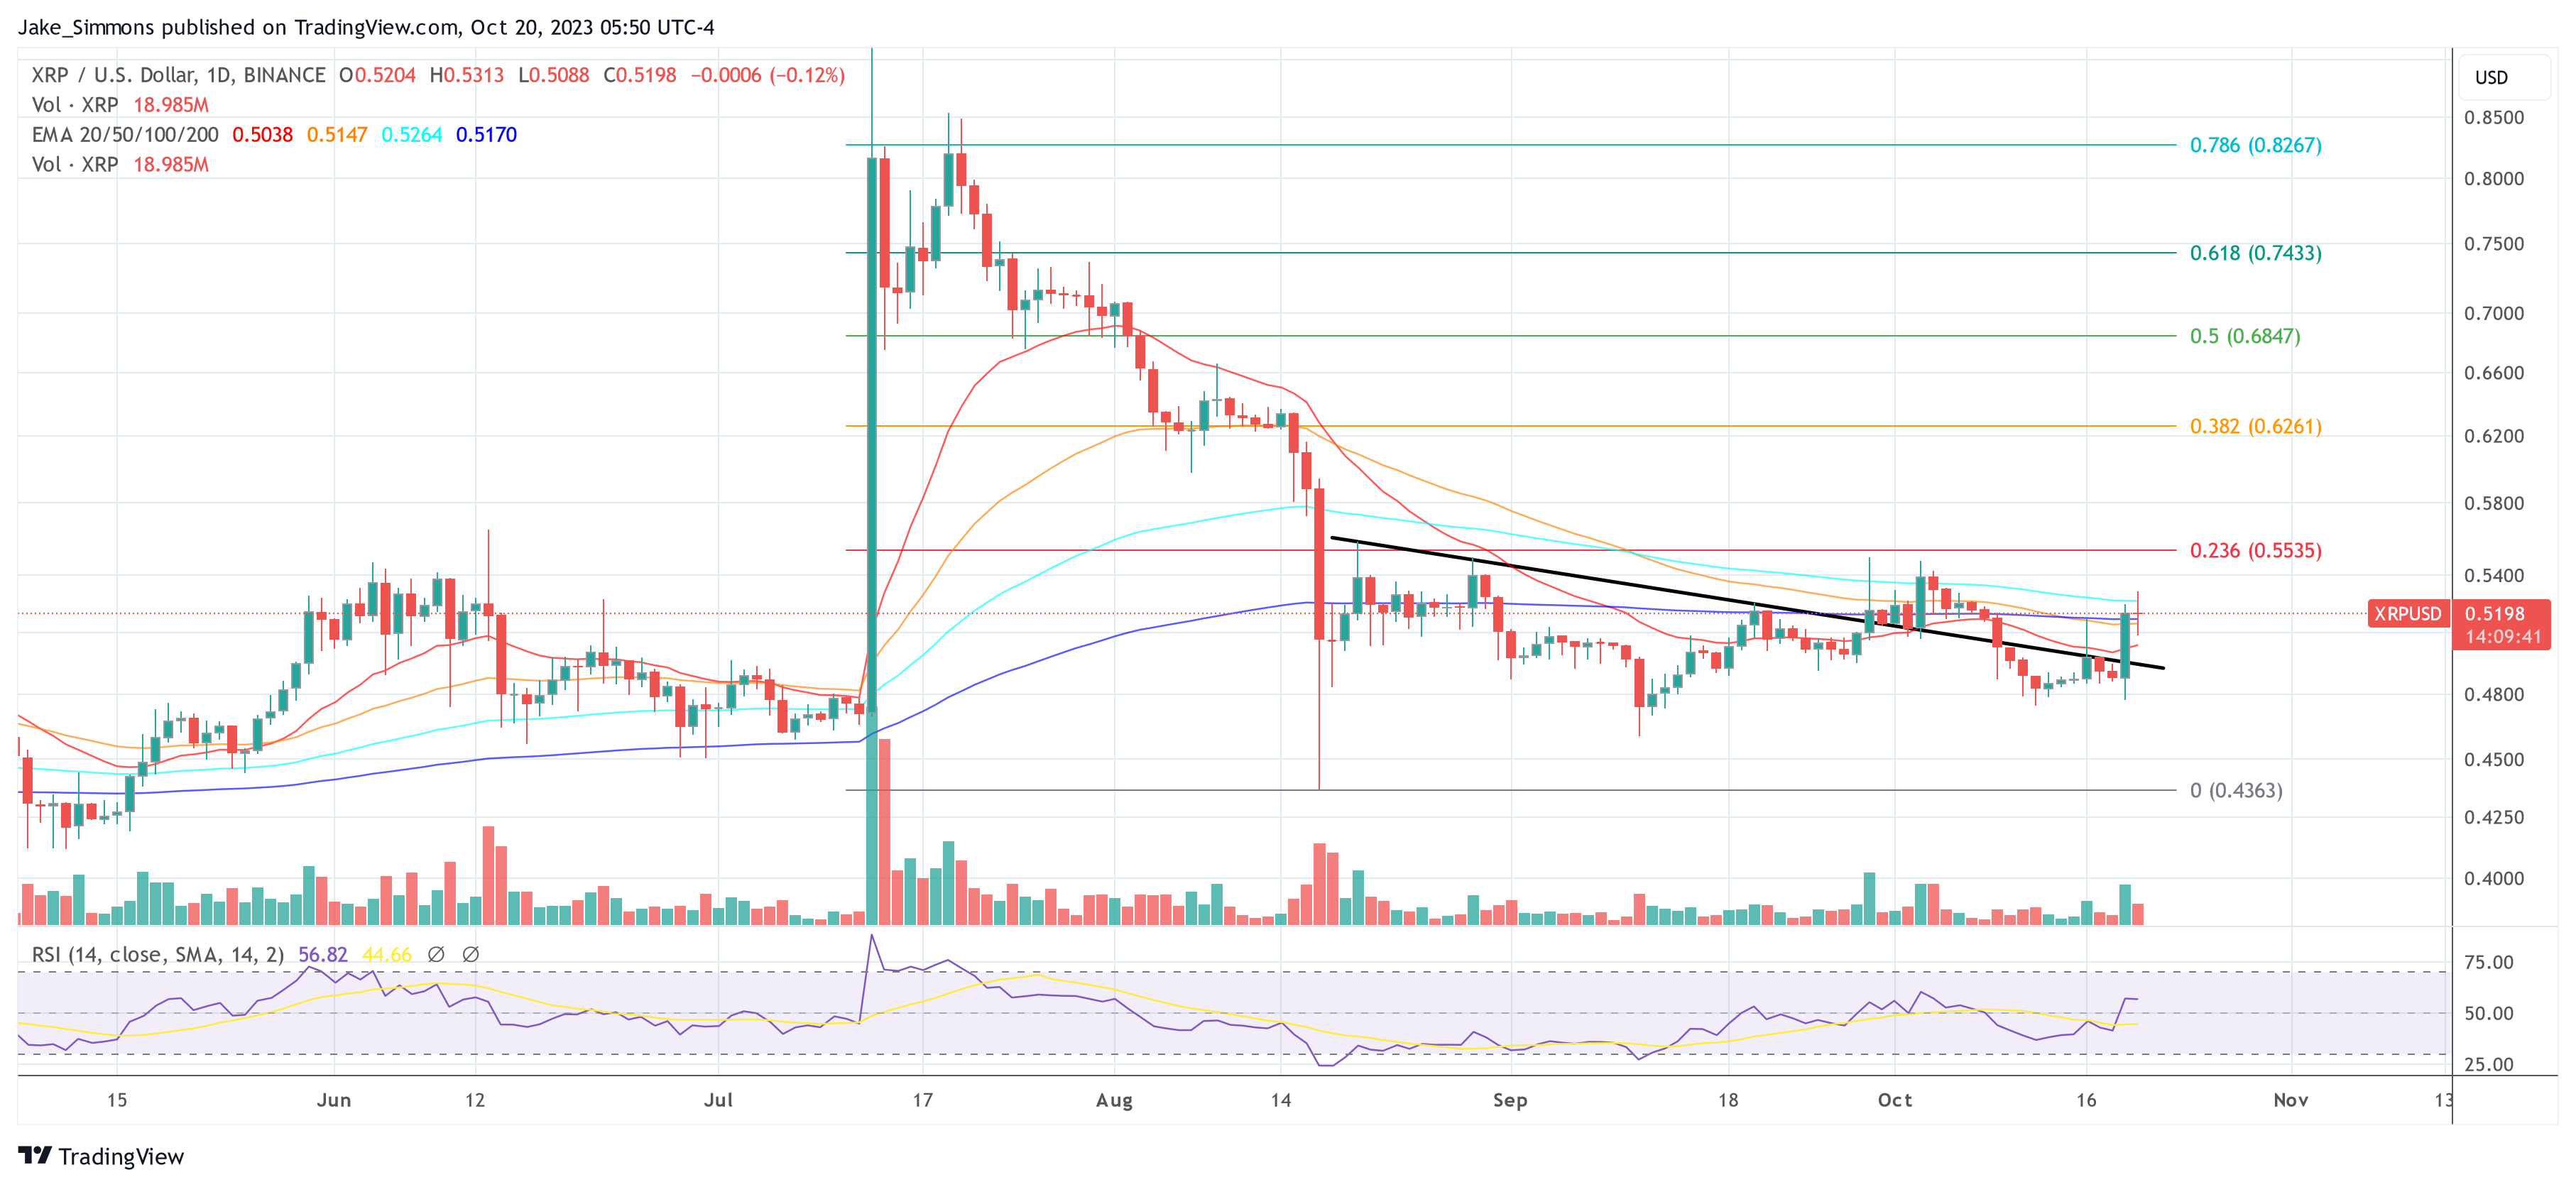
First, the cryptocurrency needs to gather momentum. He suggests that it needs to break past the $0.54 mark, at least on the daily chart. Second, the Stochastic RSI (SRSI) for the weekly timeframe should cross the 20-level, indicating potential for a bullish move. Lastly, the most important point in Jaydee’s analysis is the yellow 6-year trendline. For XRP to witness a parabolic move, breaking this trendline is imperative.
At press time, XRP traded at 0.5198.
Featured image from iStock, chart from TradingView.com
- SEO Powered Content & PR Distribution. Get Amplified Today.
- PlatoData.Network Vertical Generative Ai. Empower Yourself. Access Here.
- PlatoAiStream. Web3 Intelligence. Knowledge Amplified. Access Here.
- PlatoESG. Carbon, CleanTech, Energy, Environment, Solar, Waste Management. Access Here.
- PlatoHealth. Biotech and Clinical Trials Intelligence. Access Here.
- Source: https://www.newsbtc.com/analysis/xrp/xrp-dominance-start-next-parabolic-price-move/

