DappRadar PRO users get more tools and insights
The NFT floor price is a common metric to indicate success for an NFT collection. A higher floor price indicates higher demand, therefore fluctuating floor prices can become trading opportunities for arbitrage traders. But also, a dropping floor price might be the once in a lifetime opportunity to get into a top tier NFT community.
DappRadar is one of the world’s biggest repositories of blockchain data. And now we’re putting the power of that information into our users’ hands. DappRadar PRO Members can enter our archives, extract historical on-chain data, and manipulate it into information.
As a PRO Member you get your hands in raw, but cleaned up blockchain data. You can download one or more CSV files, import those into Excel or Google Sheets, and then start working some magic.
In this guide we will explain how you can use the floor prices of an NFT collection to analyze its value. A dropping floor price might indicate a buying opportunity.
What is a floor price?
When determining the value of an NFT, the current floor price is always a good starting point. The floor price is the lowest price a seller is willing to accept for an NFT in a particular collection.
However, it’s worth noting that floor prices can be manipulated to make a collection appear more sought-after than it actually is, and their usefulness is not straightforward.
To find out if the floor price is driven by the overall market or has been artificially inflated, check the recent average sale prices. If the average sale price is well below the floor price, this is a strong signal that someone is manipulating the floor price.
Go to DappRadar’s NFT Collections page and check any collection’s current floor price and average sale price. You can see the data for the past 15 minutes or for a project’s entire trading history. It takes two minutes and could save you a lot of money.
How to download your CSV file
DappRadar has been compiling and aggregating blockchain data since 2018. Now our PRO users can access this raw data, manipulate it, then turn it into real insights to help them beat the Web3 market.
Here’s a step-by-step guide for how you would download a CSV file of historical CloneX data:
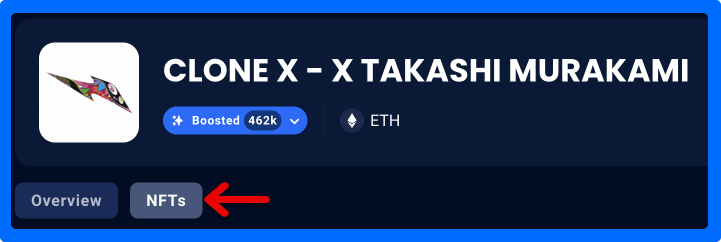
1. Go to CloneX single dapp page.
Once you’ve arrived here, you need to click on the NFTs tab which takes you to all of the information and data surrounding the NFT collection.
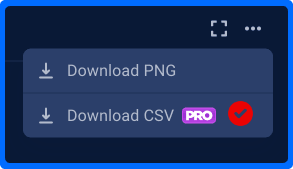
2. Find the Donwload CSV button.
Scroll down to the ‘NFT collection floor price’ chart and choose your date range. It can be seven days, 30 days or all-time data. The date range you choose will be the date range you download your data for.
Then, find the ellipsis on the right-hand side.

3. Click on Download CSV.
Your file will automatically start downloading. Bear in mind that you need to be a PRO user to have access to this feature. Holding 5,000 RADAR tokens will give you PRO membership.
How to turn CSV data into a chart
Once you have the CSV files on your computer, it’s time to combine them and create a chart.
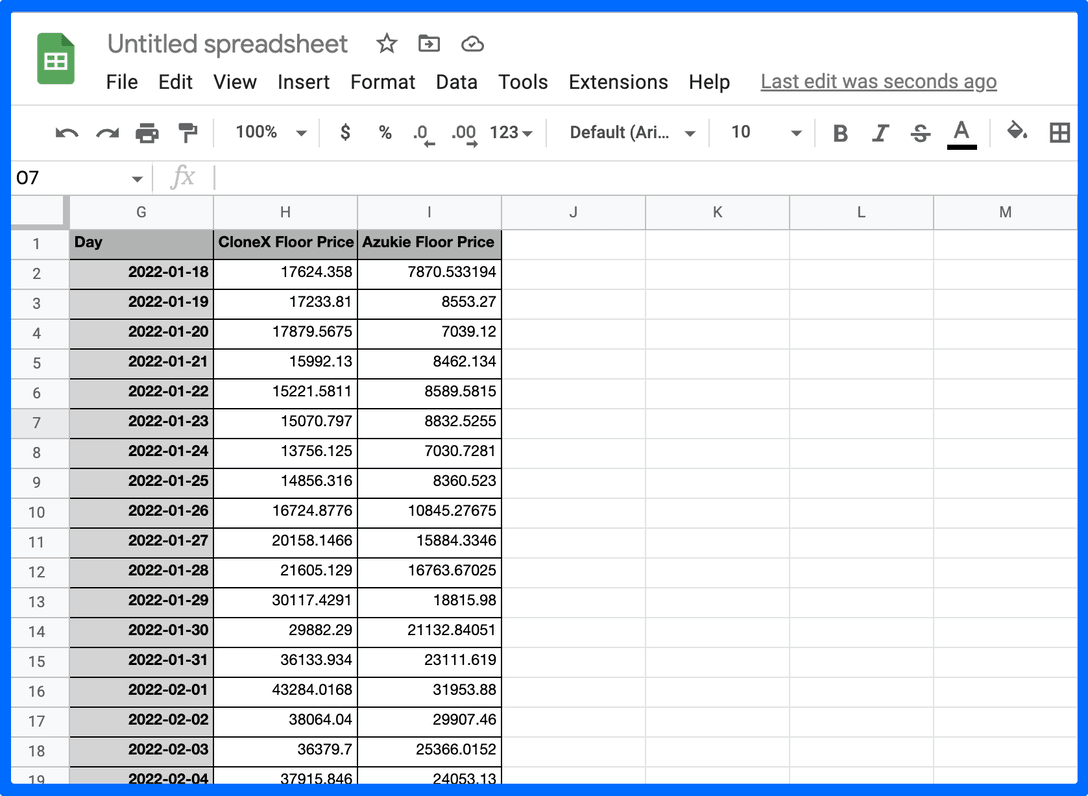
- Import CSV data into your spreadsheet software.
- You will have a column with dates and one with floor price.

- If you want to use data from various dapps or collection, add another one (make sure you name the columns so you know which one is which).

- Now align the data based on the dates.
- If all goes well, you now have 3 columns:
- Dates
- Floor Price for dapp A
- Floor Price for dapp B
- You can now alter the data sheets, for example by showing weekly or monthly volumes instead of daily data sets.
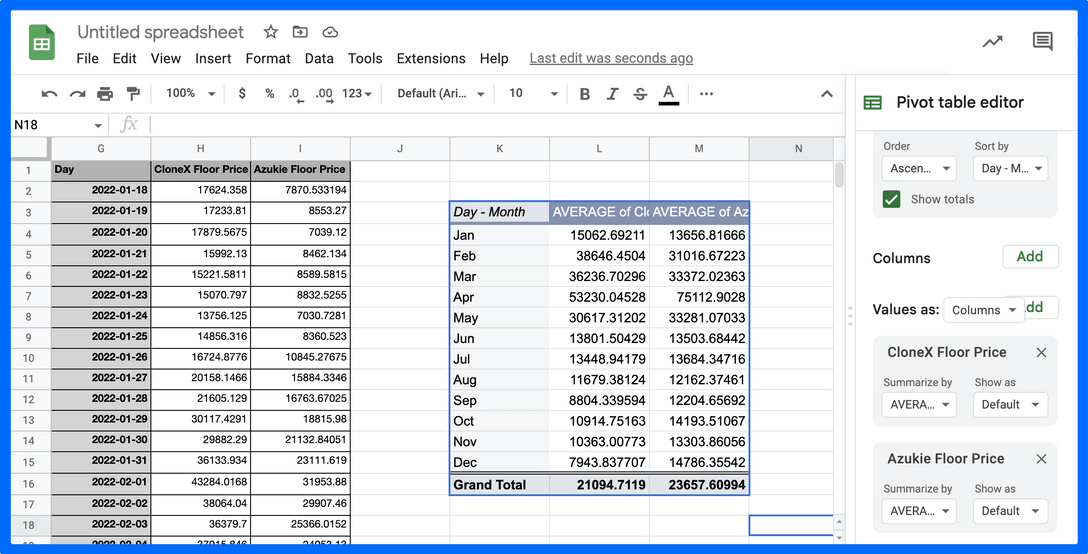
- Once you’re done with the creation of your data sets, it’s time to visualize this data.
- Click on your pivot table and insert a graph of your choice.

Now you have your own graph to carry out your own analysis.
Turning data into insights
The data in your hands is only as good as your ability to manipulate it. While the below is neither expert analytical research nor financial advice, it is an example of the kind of thing you could do with DappRadar’s data.
History never repeats itself, but it does often rhyme. Take the data from other blue chip collections and see if you can find any correlation between their price charts. Below is a graph for CloneX that took three minutes to put together.
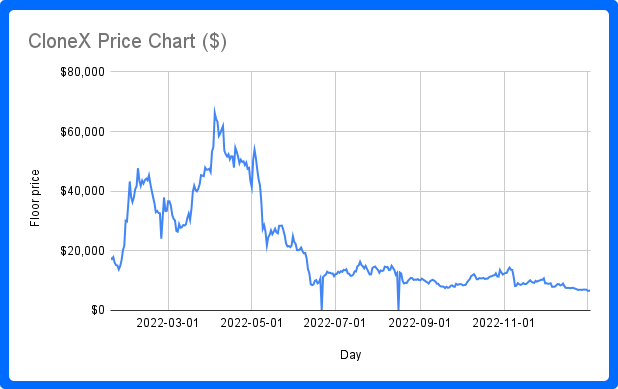
If I plot this floor price trend against another similar blue chip, what will I find? Azuki and CloneX are the same age, so let’s see what happens if we compare the two.
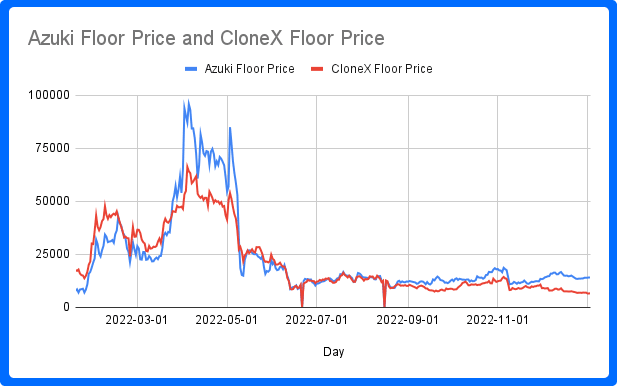
We see that the two floor prices are fairly closely aligned but began diverging towards the end of November 2022. Now we can investigate what happened around this period and find reasons for why these lines are moving apart.
If we go a step further now, and we know that historically the floor prices for these collections have always been closely correlated, then it might be a good time to buy a CloneX NFT. This would be based on the educated assumption that it might climb up to Azuki price levels at some point over the next six months?
Beware, the floor price is set by sellers
It’s important to be aware that only those who own NFTs in a collection can set the floor price. However, these individuals may not necessarily be trustworthy or reliable indicators of value. They could potentially be trying to deceive buyers.
Additionally, NFT holders may try to artificially inflate the floor price of a collection by agreeing not to sell for less than a certain price, regardless of the collection’s actual value. For example, if a group of NFT holders conspired to not sell their NFTs for less than 100 ETH, even though the true value is lower, they could artificially increase the floor price.
There is also a practice called “sweeping the floor,” which involves buying multiple NFTs in a collection at the floor price. This could indicate that the project is gaining momentum, but it could also be a tactic used by a single entity to manipulate the floor price.
Another form of manipulation is called wash trading, where the buyer and seller in a transaction are the same or collude together. For example, an owner of a BAYC NFT might list their NFT at an inflated price and then buy it back themselves.
While floor price can be a useful tool for NFT traders to understand the popularity and entry point for buying NFTs in a collection, it’s important to exercise caution and consider multiple data points before making a decision.”
Other use cases for CSV data
As a PRO member you have access to a wide range of data points. When it comes to NFT collections you can find the following data:
- NFT trading volume
- NFT collection floor prices
If these collections tie in with a decentralized application, for example if we’re talking about collectibles that can be used in a game that offers a token reward system, then you could also download dapp overview data.
As a DappRadar PRO member you can download the CSV files and compare all kinds of dapps and NFT collections. It allows you to see trends. For example, you can make your own charts for a select number of NFT collections, or you can track the performance of the NFT collections you consider to be blue-chips.
Carry your Web3 journey with you
With the DappRadar mobile app, never miss out on Web3 again. See the performance of the most popular dapps, and keep an eye on the NFTs in your portfolio. Your account on DappRadar syncs with our mobile app, giving you soon the option to receive alerts live as they happen.

- SEO Powered Content & PR Distribution. Get Amplified Today.
- Platoblockchain. Web3 Metaverse Intelligence. Knowledge Amplified. Access Here.
- Source: https://dappradar.com/blog/dappradar-pro-member-floor-prices-csv-file

