- Goods-based inflationary pressures in the US may resurface in H2 2024 due to leading bullish momentum built-up in commodities.
- Persistent low correlation readings among S&P 500 constituents may trigger a spike in the VIX.
- The leading Nasdaq 100 has displayed bearish reversal elements.
The US stock market continued to hit another milestone last week when the benchmark S&P 500 recorded 14 weekly gains in the past 15 weeks as of 9 February 2024, its longest winning streak since 1972.
Overall, among the major US benchmark stock indices, the rally has been led by the Nasdaq 100 which recorded a year-to-gain of 8.56% as of 9 February surpassing the S&P 500 (+6.04%) and the S&P 500 equal-weighted exchange-traded fund (+0.68%) over the same period.
The bulk of the Nasdaq 100’s rally has been attributed to the top 7 mega capitalization US stocks in which the Artificial Intelligence (AI) theme play juggernaut, NVIDIA rose by +44.50%, almost 5 times more than the Nasdaq 100 (see Fig 1).
AI theme play is leading the bullish camp (again)
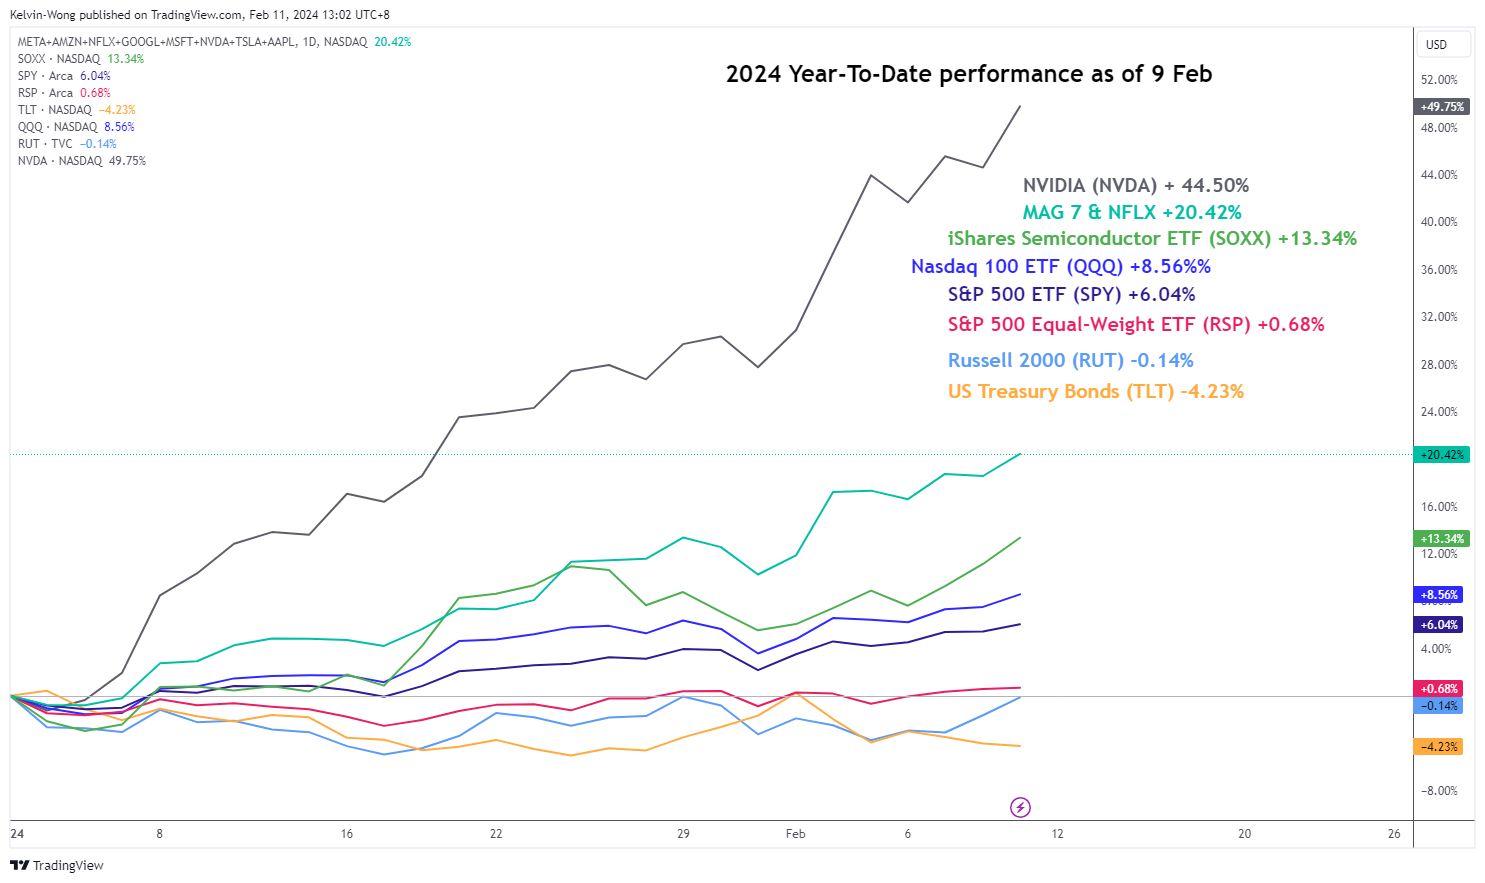
Fig 1: Year-to-date performance of major US benchmark stock indices & key ETFs as of 9 Feb 2024 (Source: TradingView, click to enlarge chart)
The hotter-than-expected US CPI inflation data for January 2024 for both headline and core components halted the “Fed dovish pivot optimism” in play since late last year that killed off the highly anticipated first Fed funds rate cut that was priced in earlier for the upcoming March’s FOMC meeting and further pushed back the expectations to the June monetary policy meeting (77% chance based on CME FedWatch Tool as of 14 February 2024).
Also, the number of expected rate cuts has been reduced from six (after last December’s FOMC meeting) to four at this juncture, almost in line with the median projection of three cuts inferred from the latest Fed’s dot-plot (summary of economic projections) released in last December.
Before yesterday’s sell-off seen in all the major US benchmark stock indices; S&P 500 (-1.37%), Nasdaq 100 (-1.58%), Dow Jones Industrial Average (-1.35%), and Russell 2000 (-3.96%), three potential ominous signs are flashing out to warn the rampant bulls that are riding on the coattails of AI and Fed dovish pivot optimism.
Goods-based inflation in the US may see an uptick next
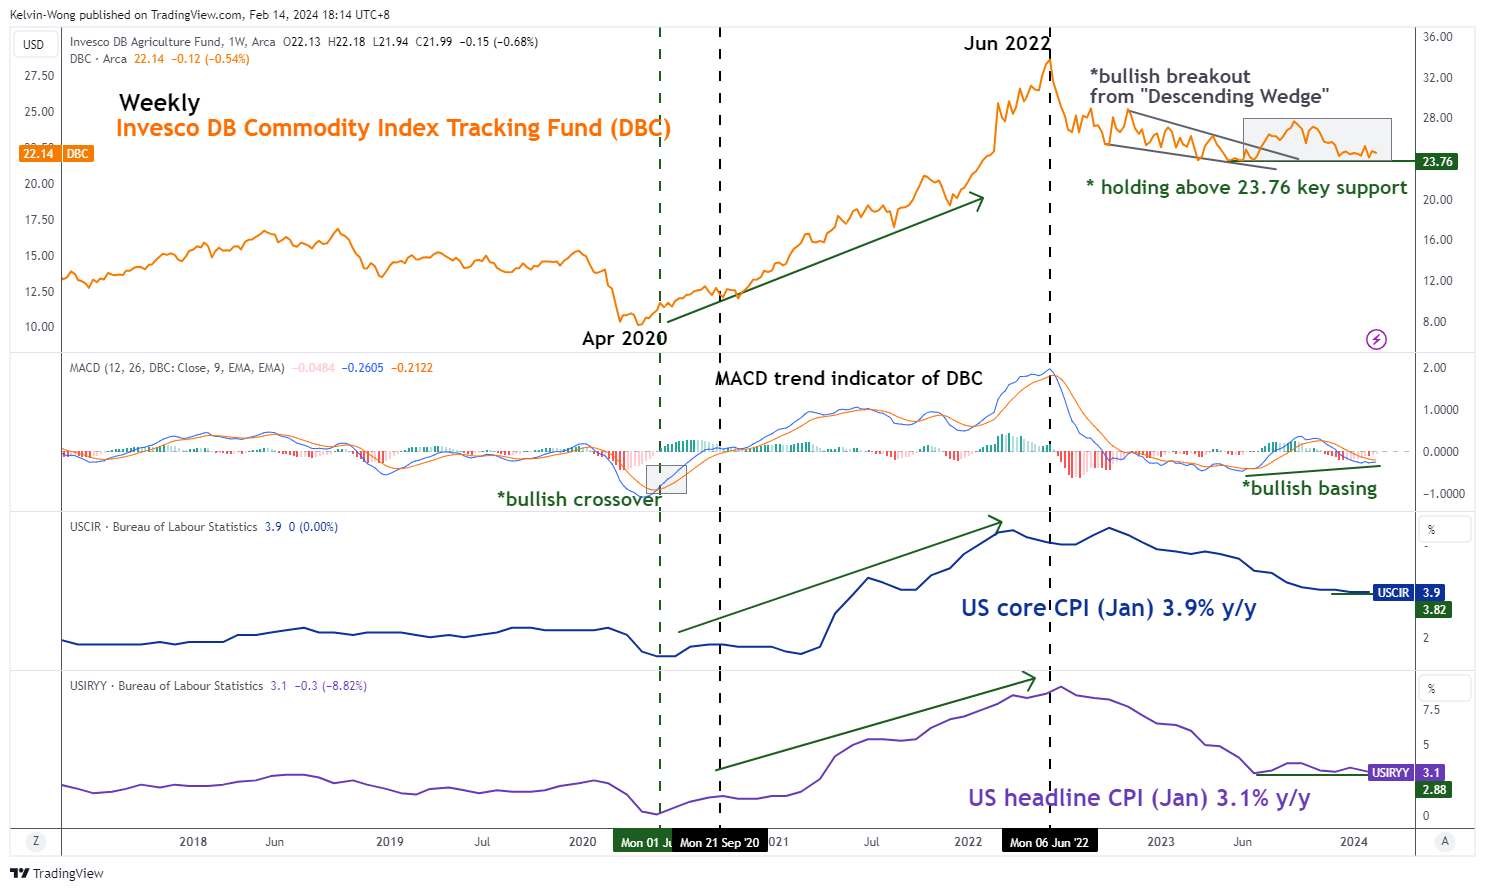
Fig 2: Invesco DB Commodity Index Tracking Fund major trend with US CPI as of 14 Feb 2024 (Source: TradingView, click to enlarge chart)
The firmer US CPI inflation data for January that has risen above forecasts has been primarily driven by the service components of the CPI basket. The supercore services inflation (CPI excluding food, energy & shelter) increased to 4.4% y/y in January from 3.9% y/y in December 2023, an eight-month high while headline inflation dipped lower to 3.1% y/y in January from 3.4% y/y in December 2023.
Headline inflation or primarily goods-based inflation (including food & energy) has a high direct linkage to prices of tradable commodities.
Using the Invesco DB Commodity Index Tracking Fund (DBC), a broad-based commodities futures exchange-traded fund with its highest weightage holding of 56% concentrated in energy-related futures and 21% (second highest) weightage in agriculture-related futures in conjunction with the trend movements of both the US headline and core CPI y/y rates to conduct an intermarket analysis.
Based on historical price actions, movements seen in the DBC tend to lead over the headline and core CPI inflation trends. Before the recent significant upsurge in the US inflation rates from September 2020 to June 2022, the weekly MACD trend indicator of the DBC flashed a bullish crossover signal earlier in June 2020 that preceded the change of DBC’s major trend from bearish to bullish.
A similar positive element can be detected in the most recent movement of the weekly MACD trend indicator of DBC where it has started to form a bullish basing formation (higher lows from June 2023 to January 2024).
If history plays out again, the current positive momentum element inherent in the DBC may lead to at least a further potential medium-term upmove in DBC which in turn could translate to a possible uptick in inflationary pressures in the real economy in H2 2024 that may put the Fed dovish pivot narrative in jeopardy.
A persistent low correlation reading among S&P 500 constituents
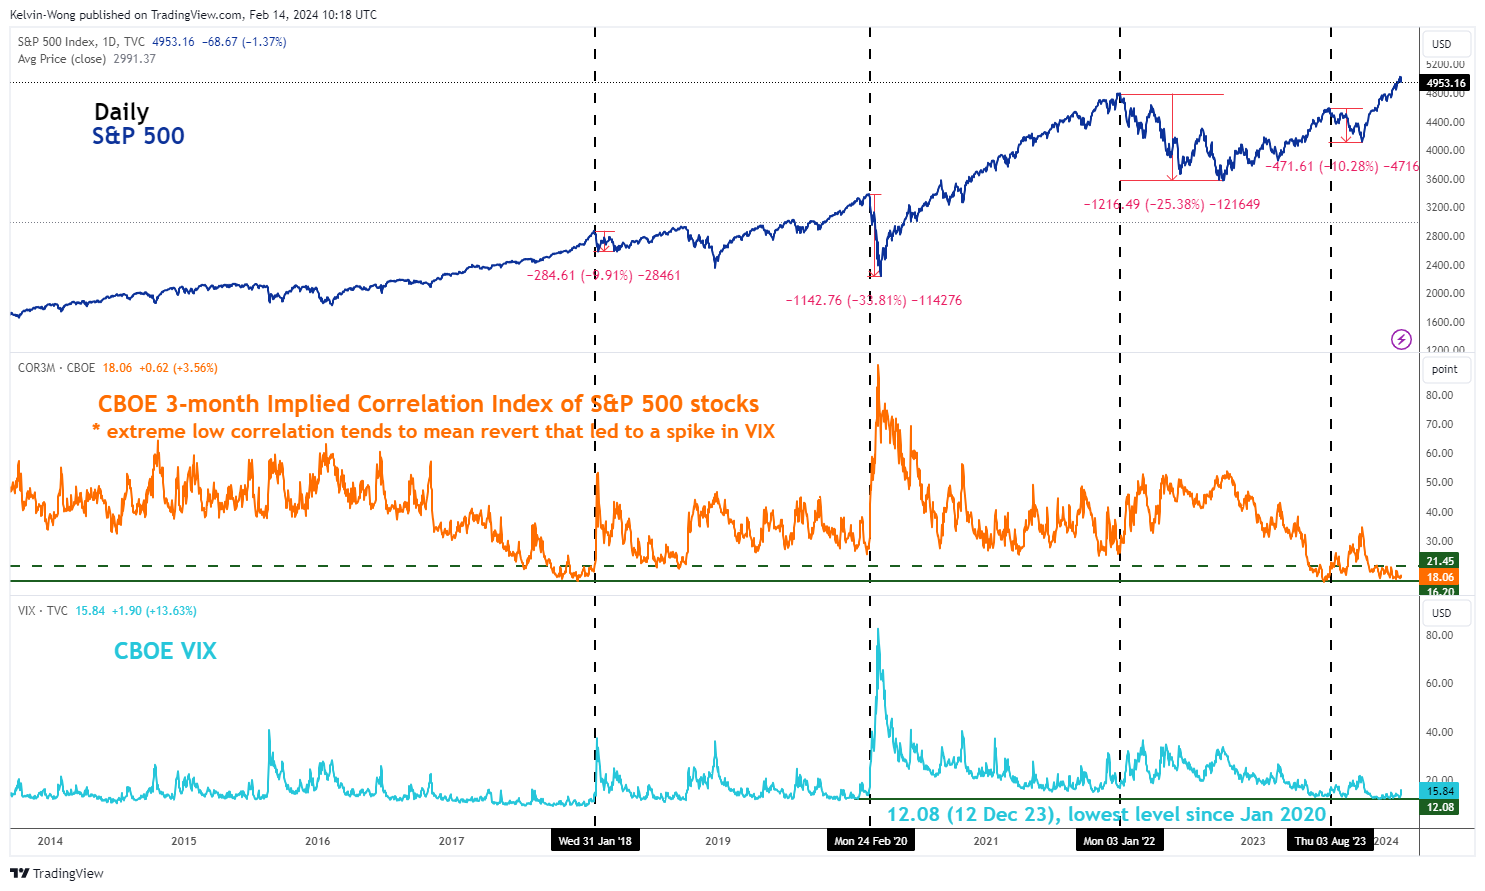
Fig 3: CBOE VIX & 3-month implied correlation index of S&P 500 constituents as of 14 Feb 2024 (Source: TradingView, click to enlarge chart)
Another interesting point to note is the recent plunge in the VIX (implied volatility of the S&P) to a 3-year low of 12.08 on 12 December 2023 which in turn coincided with market participants’ perceptions of future low correlation readings (higher dispersion of returns on the average) among the US S&P 500 index constituents.
The CBOE 3-month Implied Correlation Index which measures the 3-month expected correlation across the top 50 value-weighted S&P 500 constituents has slipped to a low reading of 17.10 on 13 December 2023 which is close to a 6-year low of 16.20 that was met recently on 18 July 2023 (see Fig 2).
CBOE 3 aylık Örtülü Korelasyon Endeksi'nin göreceli "düşük sakin" seviyesi muhtemelen sonsuza kadar sürmeyecek. Geçmişteki olaylara göre, CBOE 21.45 aylık Örtülü Korelasyon Endeksi'nin önceki düşük seviyeden sonra 3'in üzerine kırılması VIX'te bir yükselişe yol açtı ve bu da S&P 10'de Ocak 500'den 2018'e kadar -%2018'luk bir düşüşe yol açtı. Mart 10.3 ve son olarak Ağustos 2023'ten Ekim 2023'e kadar %-XNUMX'lük bir kayıp.
The leading Nasdaq 100 has shaped a potential bearish reversal configuration
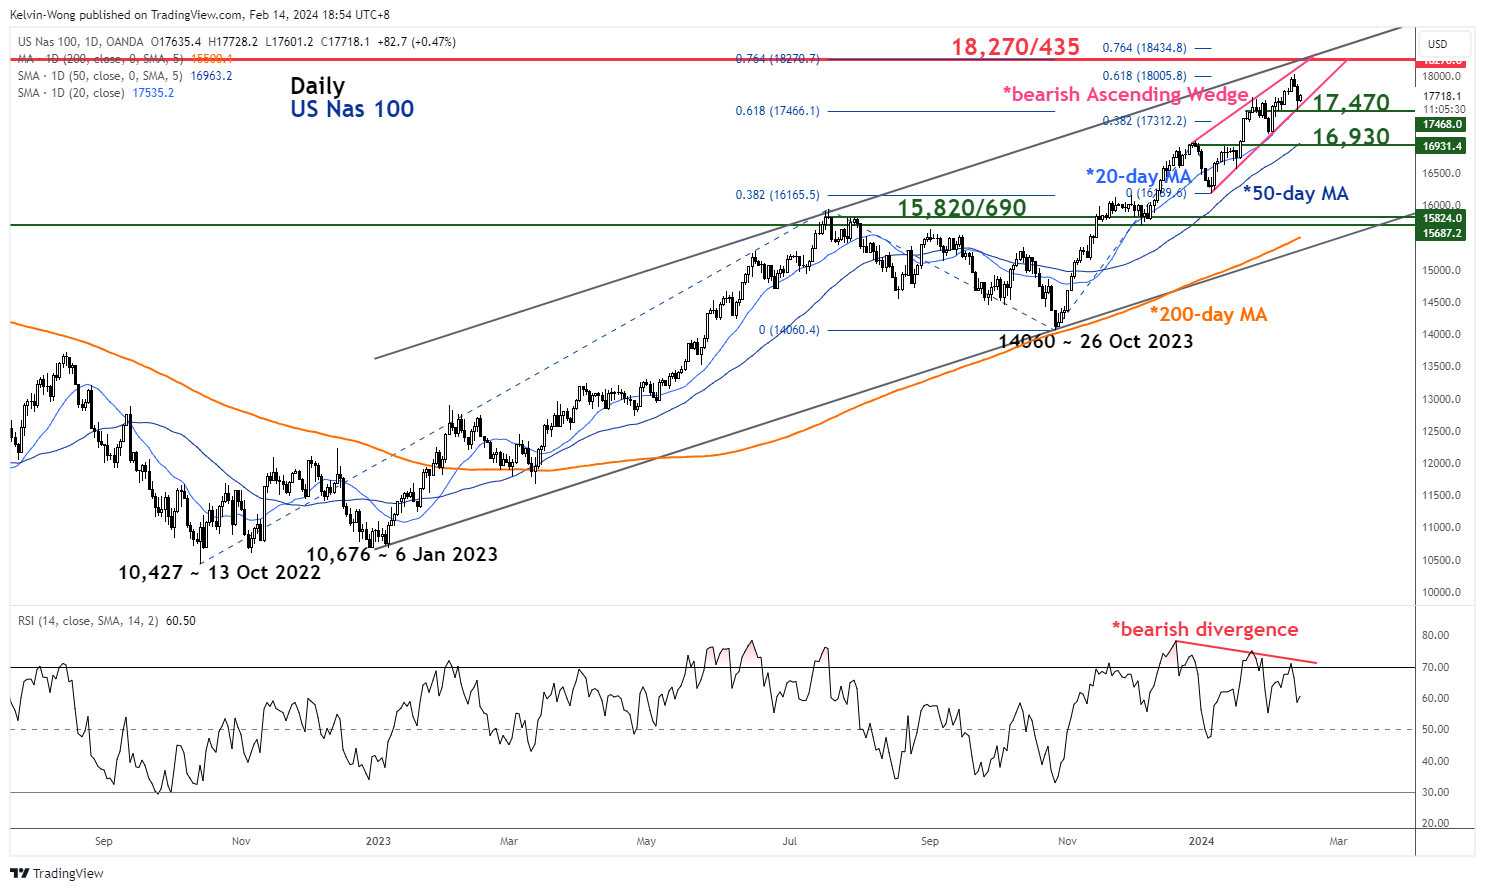
Fig 4: US Nas 100 medium-term & major trends as of 14 Feb 2024 (Source: TradingView, click to enlarge chart)
The recent eight weeks of price action movement seen in the ABD Nas 100 Endeksi (a proxy for the Nasdaq 100 futures) has traced out an impending bearish reversal “Ascending Wedge” configuration as seen on its daily chart.
The appearance of the bearish “Ascending Wedge” coupled with a triple bearish divergence condition seen on the daily RSI momentum indicator at its overbought region suggests a weakening upside momentum despite the Index hitting a recent fresh all-time high of 18,043 on Monday, 12 February.
These observations suggest that the recent major uptrend phase in place since the 13 October 2022 low of 10,427 may be approaching a terminal point soon and a potential multi-week corrective decline may unfold next.
The potential terminal resistance zone stands at 18,270/435 which confluences with the intersection of the upper boundaries of the major ascending channel and “Ascending Wedge” as well as a Fibonacci extension cluster level.
A break below the key near-term support of 17,470 (the lower boundary of the Ascending Wedge) and 20-day moving average) may trigger the start of the potential multi-week corrective decline with the next intermediate support coming in at 16,930 (50-day moving average) followed by the major support zone of 15,820/690 (also the 200-day moving average).
İçerik yalnızca genel bilgi amaçlıdır. Yatırım tavsiyesi veya menkul kıymet alıp satma çözümü değildir. Görüşler yazarlardır; OANDA Business Information & Services, Inc.'in veya bağlı kuruluşlarının, yan kuruluşlarının, memurlarının veya müdürlerinin olması zorunlu değildir. OANDA Business Information & Services, Inc. tarafından üretilen ödüllü bir forex, emtia ve küresel endeksler analizi ve haber sitesi hizmeti olan MarketPulse'ta bulunan herhangi bir içeriği çoğaltmak veya yeniden dağıtmak isterseniz, lütfen RSS beslemesine erişin veya şu adresten bizimle iletişime geçin: [e-posta korumalı]. Ziyaret https://www.marketpulse.com/ küresel pazarların ritmi hakkında daha fazla bilgi edinmek için. © 2023 OANDA Ticari Bilgiler ve Hizmetler A.Ş.
Finansal piyasalardaki noktaları birleştirme ve ticaret ve yatırımla ilgili perspektifleri paylaşma konusunda tutkulu olan Kelvin Wong, finansal piyasalardaki temel tersine dönüş seviyelerini belirlemek için Elliott Wave ve fon akışı konumlandırmasında uzmanlaşmış, temel ve teknik analizlerin benzersiz bir kombinasyonunu kullanma konusunda uzmandır. pazarlar.
Buna ek olarak, son on yılda Kelvin binlerce perakende tüccar için çok sayıda piyasa görünümü ve ticaretle ilgili seminerin yanı sıra teknik analiz eğitim kursları da düzenledi.
Kelvin Wong'un son gönderileri (Tümü)
- SEO Destekli İçerik ve Halkla İlişkiler Dağıtımı. Bugün Gücünüzü Artırın.
- PlatoData.Network Dikey Üretken Yapay Zeka. Kendine güç ver. Buradan Erişin.
- PlatoAiStream. Web3 Zekası. Bilgi Genişletildi. Buradan Erişin.
- PlatoESG. karbon, temiz teknoloji, Enerji, Çevre, Güneş, Atık Yönetimi. Buradan Erişin.
- PlatoSağlık. Biyoteknoloji ve Klinik Araştırmalar Zekası. Buradan Erişin.
- Kaynak: https://www.marketpulse.com/indices/us-stock-market-bulls-are-facing-a-reality-check-3-ominous-signs-to-watch/kwong

