Join Our Telegram channel to stay up to date on breaking news coverage
As investors await a bullish run, about 10% of cryptocurrencies display green candles. UMA is today’s top crypto gainer, hitting an impressive 112.55% gain in the last 24 hours. Conversely, Conflux Network takes the spotlight as today’s top loser, experiencing a loss of 19.40% in the same period.
Biggest Crypto Gainers Today – Top List
Moreover, Dogwifhat showcased an extraordinary 7,489.77% gain in the past year. Meanwhile, ApeCoin is at the opposite end, witnessing a substantial loss of 70.69% over the past year. Following the introduction of the first U.S. spot BTC ETFs, Bitcoin (BTC) has significantly dropped, plunging by more than 15% to approximately $41,300.
1. Pendle (PENDLE)
Pendle’s price is $ 2.15, followed by a trading volume of $ 154.87 million. With a market capitalization of $512 million, Pendle boasts a market dominance of 0.03%. Over the past 24 hours, the PENDLE price has surged by an impressive 8.49%.

Furthermore, Pendle has seen an extraordinary price increase of 1,878% in one year, outshining 99% of the top 100 coins. The recent cycle reached a pinnacle with a high of $ 2.17. Moreover, Pendle currently has a circulating supply of 238.19 million PENDLE out of its maximum supply of 258.45 million.
If you’re staring at this and you’re wondering how you can ape more YT-eETH, our intern’s thread may just be able to shed some light 💡 https://t.co/SYPBiHaCJr pic.twitter.com/WMJSBXvte8
— Pendle (@pendle_fi) January 16, 2024
In addition, the yearly supply inflation rate stands at 24.25%, creating 46.49 million PENDLE over the last year. Technically, Pendle is trading above the 200-day simple moving average, signaling a positive trend. The sentiment for Pendle’s price prediction remains bullish, supported by a Fear & Greed Index score of 64 (Greed).
2. Litecoin (LTC)
A few days into 2024, Litecoin has hit over 10 million transactions on its network. As such, LTC is growing in the interim by 1.98% to $70.34. Moreover, trading volume is robust at $922.94M, added by dominance of 0.32%. While the market maintains a neutral stance, traders can hold as a bull is perceived.
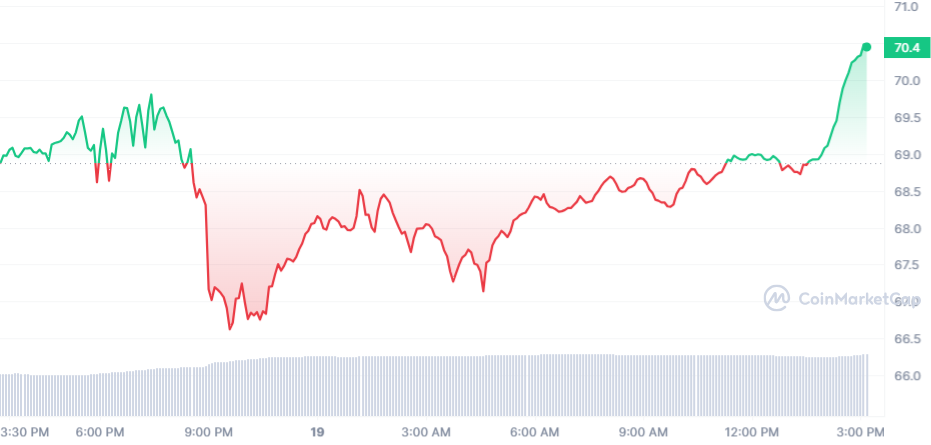
LTC has made the top crypto gainers today, so these metrics are worth highlighting. Litecoin’s highest price was $410.76 on May 10, 2021. Meanwhile, its lowest at $1.113740 on January 14, 2015. However, following a cycle low of $40.47, Litecoin surged to a peak of $114.66 in the last cycle.
The Litecoin network has processed over 10 MILLION transactions in 2024. It’s just Jan 14th. $LTC ⚡️ pic.twitter.com/VMxq0sA7EE
— Litecoin (@litecoin) January 15, 2024
Furthermore, Litecoin’s circulating supply currently stands at 74.11 million LTC out of a maximum supply of 84.00 million LTC. Likewise, the yearly supply inflation rate is 3.37%, creating 2.42 million LTC in the past year. In the Proof-of-Work Coins sector, Litecoin holds the third position, also securing the thirteenth spot in the Layer 1 sector.
3. Chainlink (LINK)
GainsNetwork announced on X that it is teaming up with Chainlink to strengthen on-chain trading security. Along the same lines, it aims to support cross-chain governance and staking. In response, the market’s attention is aroused as LINK has risen by 0.08 per $15.32, reaching.
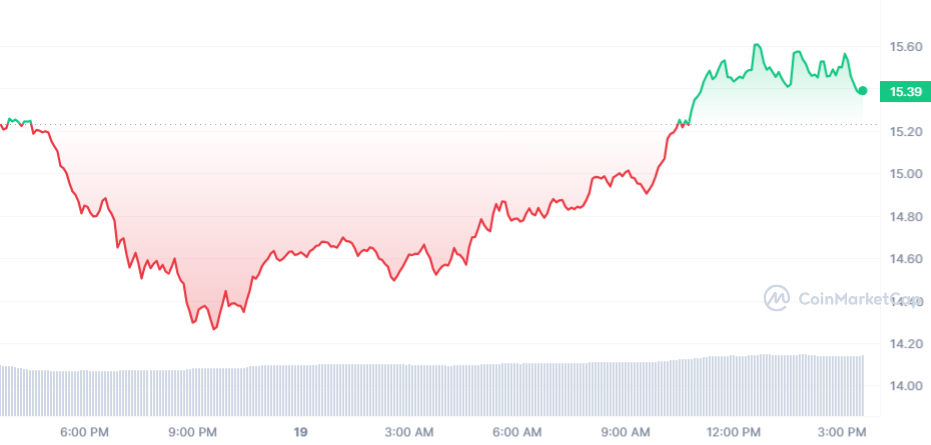
Relative to the top 100 coins, Link has outperformed 80%, hitting a 142% value increase. Moreover, Chainlink moved above the 200-day SMA after reaching 15 green days in the last 30 days. The market is neutral; however, traders are still bullish on LINK. Besides, an intraday trading volume of $1.41 billion ensures that LINK maintains a market dominance of 0.53%.
.@GainsNetwork_io is integrating #Chainlink Data Streams and CCIP to help secure onchain trading and power cross-chain governance and staking.
How the Chainlink platform unlocks next-gen DeFi ⬇️https://t.co/EaD7RQOkRh
— Chainlink (@chainlink) January 18, 2024
Moreover, the circulating supply stands at 568.10 million LINK out of a max supply of 1.00 billion LINK. Meanwhile, the annual supply inflation rate is 11.83%, creating 60.10 million LINK last year. Chainlink is leading the DeFi Coins sector and securing the second spot in the Ethereum (ERC20) Tokens sector based on market cap.
4. Huobi Token (HT)
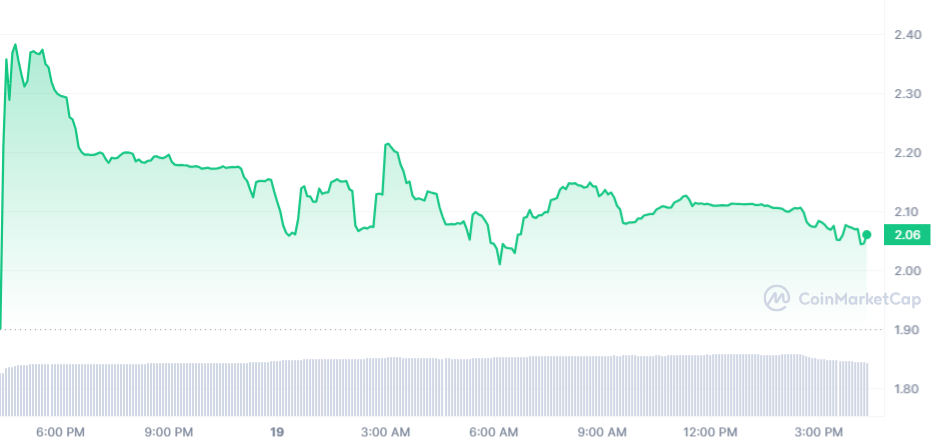
Valued at $2.05, Huobi Token is slowly overcoming the red candles, rising 7.93% intraday. To build on that, HT is establishing itself in the market, with a trading volume of $26.16 million. Similarly, the token boasts a market cap of $333.03 million, exhibiting robust liquidity.
Meanwhile, investors are cautious as predictions reflect bearish outlooks. Nonetheless, the neutral stands of the Fear/Greed index suggest that trades are holding given an upward trend.
🔥New HTX listing Alert!$RUNE @THORChain
✅️ Deposits Now Available
📈Trading Starts 1/19 20:00 (UTC+8)Details>>https://t.co/Ix7eCf6YgV pic.twitter.com/bic9FqZK8g
— HTX (@HTX_Global) January 19, 2024
In retrospect, Huobi Token reached its pinnacle on May 12, 2021, hitting an all-time high of $39.68. Conversely, its all-time low of $0.888347 was recorded on January 30, 2019. Notably, the token’s lowest price since its ATH is $1.868100, representing a cycle low. In contrast, the highest HT price since the last cycle low reached $2.41, underscoring the token’s resilience.
5. Decentraland (MANA)
Decentraland is catching the interest of investors even as the market is relatively neutral. Currently priced at $0.456422, MANA has shown positive strides by consistently trading above its 200-day SMA.
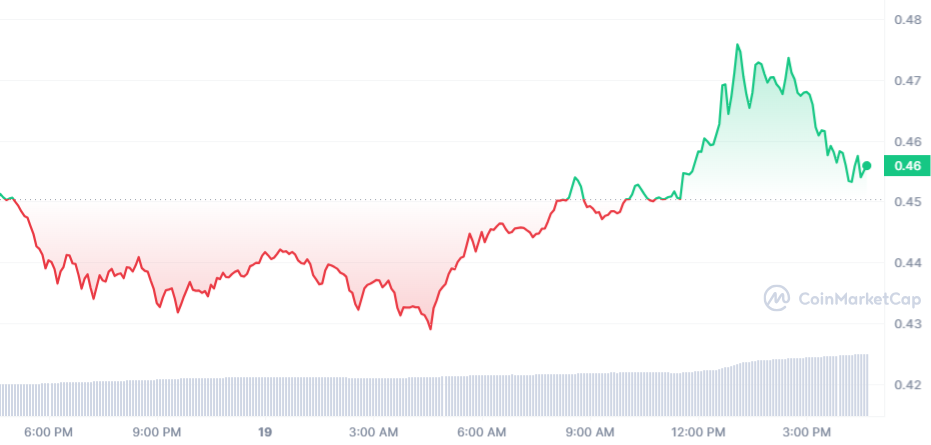
Crucially, MANA has outperformed its token sale price, boasting 15 green days in the last 30 days. These green candle days reflect a solid 50% positive performance. As an extension, this consistent upward momentum aligns with its status as a Binance-listed asset. Therefore, It ensures high liquidity in its market cap of $864.05M.
Starting your journey in Decentraland? 🌟
Create your new digital wallet with ease! 🚀
Watch this step-by-step video to learn about Social Sign In. 📽️https://t.co/0UkGyh3i2i
— Decentraland (@decentraland) January 15, 2024
Furthermore, MANA’s current market dominance is 0.05%, signifying a presence in the crypto space. Despite this, the Decentraland price prediction sentiment leans bearish as holders await a resurgence.
6. Pocket Network (POKT)
Pocket Network had a strong week, raking in an impressive 11.5K POKT in protocol revenue through the POKT burn process. This success is attributed to the smooth processing of 2.8 billion relays across its 2 Gateways.
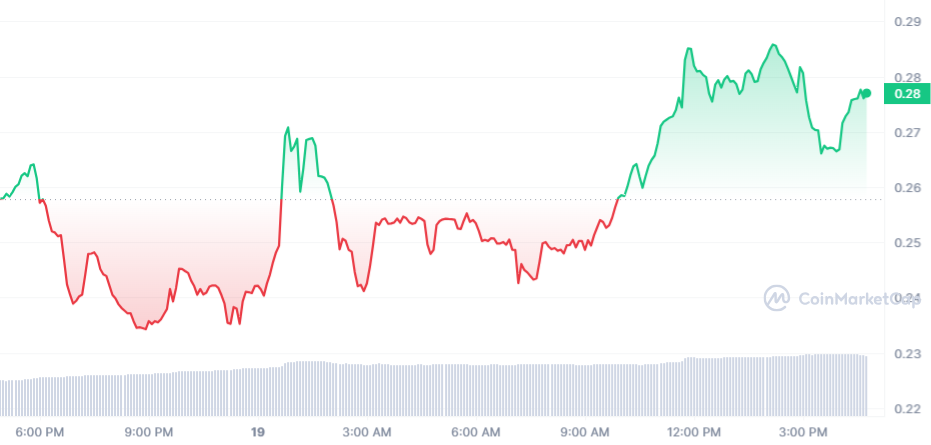
Furthermore, Pocket Network’s price prediction is optimistic, with holders watching how the market unfolds. Presently valued at $0.278299, POKT has seen a 7.67% increase in the last 24 hours and a market dominance of 0.03%. Over the past year, POKT’s price has surged by an impressive 439%, outperforming 91% of the top 100 crypto assets.
This week, we generated 11.5K POKT of protocol revenue through the POKT burn.
These earnings reflect the total fees collected from our 2 Gateways for the 2.8B relays that seamlessly ran through POKT Network’s protocol last week.
Check out the chain performance stats below 🧵 pic.twitter.com/zgHPmrIeiJ
— Pocket Network (@POKTnetwork) January 18, 2024
Moreover, trading trends favor POKT, suggesting that the green candles remain. In tandem with the trends, Pocket Network consistently traded above the 200-day SMA, indicating market strength. In addition, it boasts a solid record of 19 green days in the last 30 days, representing 63% of the observed period.
7. Sponge V2 ($SPONGE V2)
Sponge is set to make a significant comeback with the launch of Sponge V2. This new project is an upgraded version that builds upon the success of its predecessor, Sponge V1.
🎉 Huge Milestone Alert! 🎉
We’ve just surpassed an incredible 5,010,192,318 $SPONGE tokens staked, valued at $3,998,276.67!
With a current APY of over 300%, our community is thriving like never before.
Join us now and absorb the damp! 🧽💦#SpongeV2 #Crypto #Altcoins pic.twitter.com/KIVvh77dQZ
— $SPONGE (@spongeoneth) January 15, 2024
Positioned to capitalize on the anticipated bull market, Sponge V2 introduces key enhancements by incorporating Play-to-Earn (P2E) utility into the Sponge Ecosystem. Moreover, Sponge’s journey has been marked by impressive growth. Beginning with an initial valuation of $1 million, Sponge V2 experienced a substantial surge.
[embedded content]
It reached a peak market capitalization exceeding $100 million in 2023, ultimately settling at $16 million. This remarkable growth underscores the project’s resilience and potential in the dynamic market.
Read More
New Crypto Mining Platform – Bitcoin Minetrix

- Audited By Coinsult
- Decentralized, Secure Cloud Mining
- Earn Free Bitcoin Daily
- Native Token On Presale Now – BTCMTX
- Staking Rewards – Over 100% APY
Join Our Telegram channel to stay up to date on breaking news coverage
- SEO Powered Content & PR Distribution. Get Amplified Today.
- PlatoData.Network Vertical Generative Ai. Empower Yourself. Access Here.
- PlatoAiStream. Web3 Intelligence. Knowledge Amplified. Access Here.
- PlatoESG. Carbon, CleanTech, Energy, Environment, Solar, Waste Management. Access Here.
- PlatoHealth. Biotech and Clinical Trials Intelligence. Access Here.
- Source: https://insidebitcoins.com/news/top-crypto-gainers-today-jan-19-chainlink-decentraland-huobi-token-pocket-network

