Join Our Telegram channel to stay up to date on breaking news coverage
Polygon is consolidating within $0.87 and $0.76 support level
Polygon (MATICUSD) Price Analysis – 28 November
An increase in the bears’ pressure will push the price to break down the support level of $0.76 and Polygon price may decrease to the support level of $0.70, and $0.64. When the buyers interrupt the buyers at the support level of $0.76, Polygon will rise to the resistance level of $0.87, this may also increase the price to $0.98 and $1.01 resistance levels.
Key Levels:
Resistance levels: $0.87, $0.98, $1.01
Support levels: $0.76, $0.70, $0.64
MATIC/USD Long-term Trend: Bearish
On the Long-term outlook, MATIC/USD price is bearish. The coin has been under the control of bears for more than three weeks. The polygon is falling from the high $1.31 resistance level. The former support levels of $1.01 and $0.98 have turned into resistance levels. The support level of $0.76 was tested on November 21. It bounced up to retest the resistance level of $0.87. At the moment the sellers are returning to the market.

The fast-moving average has crossed the slow-moving average downside. MATIC is trading below the 9-periods EMA and 21-periods EMA as evidence of bearish momentum. An increase in the bears’ pressure will push the price to break down the support level of $0.76 and the MATIC price may decrease to the support level of $0.70, and $0.64. When the buyers interrupt the buyers at the support level of $0.76, Polygon will rise to the resistance level of $0.87, this may also increase the price to $0.98 and $1.01 resistance levels.
MATIC/USD Short-term Trend: Bearish
Polygon is bearish on the medium-term outlook. The polygon market is experiencing a bearish movement toward the support level of $0.76 level. The just-mentioned level was tested on November 21 but bears could not penetrate the level downside. The price is consolidating within the $0.84 and $0.76 levels.
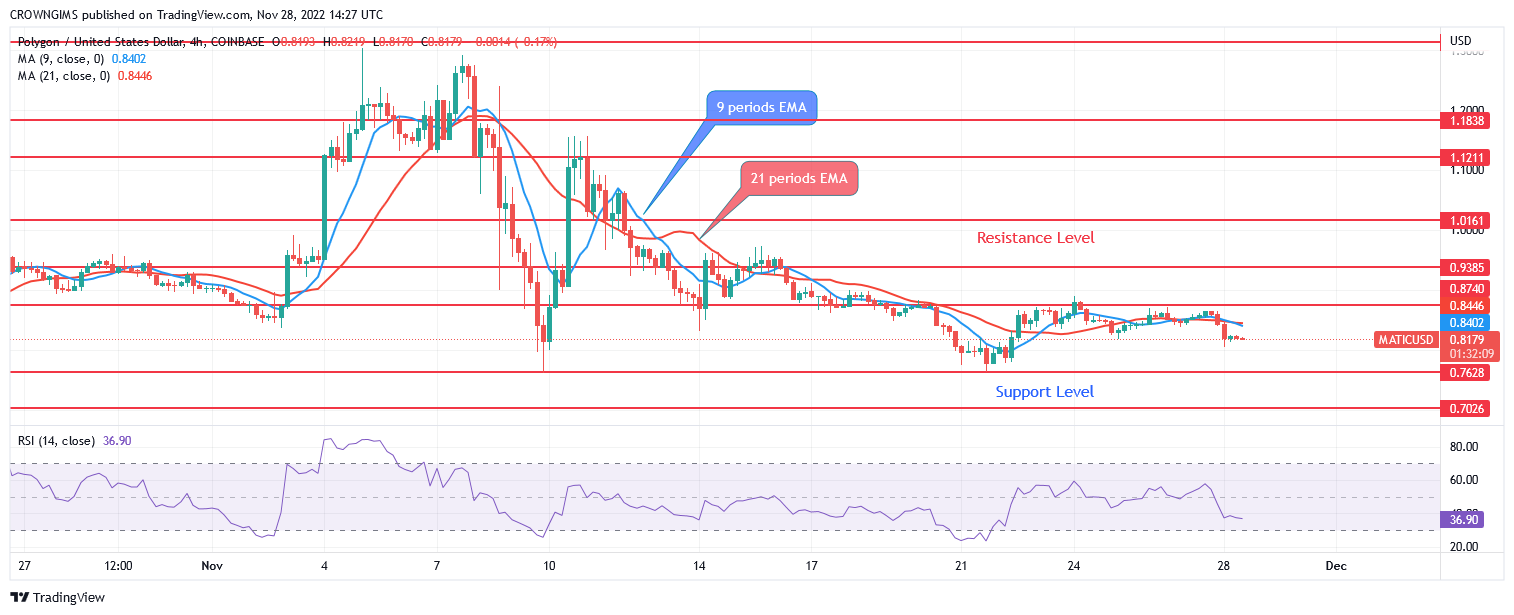
The Polygon price is trading below the two EMAs which indicates a bearish trend. The 9-day EMA is interlocked with the 21-period EMA. The relative strength index period 14 is at 39 levels with the signal line pointing down which indicates a sell signal.
You can purchase Lucky Block here. Buy LBLOCK
Join Our Telegram channel to stay up to date on breaking news coverage
- Coinsmart. Europe’s Best Bitcoin and Crypto Exchange.Click Here
- Platoblockchain. Web3 Metaverse Intelligence. Knowledge Amplified. Access Here.
- Source: https://insidebitcoins.com/news/polygon-price-will-there-be-a-further-price-reduction

