The percentage of Bitcoin ($BTC) investors holding onto the flagship cryptocurrency for longer periods of time reached a new all-time in December of last year, as HODLers are weathering the bear market while waiting for a trend reversal.
According to data from leading digital asset market data provider, cryptocurrency markets have seen a “surprisingly positive start to 2023,” with $BTC moving up 25.1% and Ethereum ($ETH), the second-largest cryptocurrency by market capitalization, 26.6%.
On its latest Market Spotlight post, CryptoCompare researchers note that there are several factors contributing to the upward move, including ownership distribution of $BTC showing long-term holder percentages have hit a new all-time high of 72.3% in December, which could be expected “following periods of consolidation where long-term holders can accumulate BTC at low prices.”
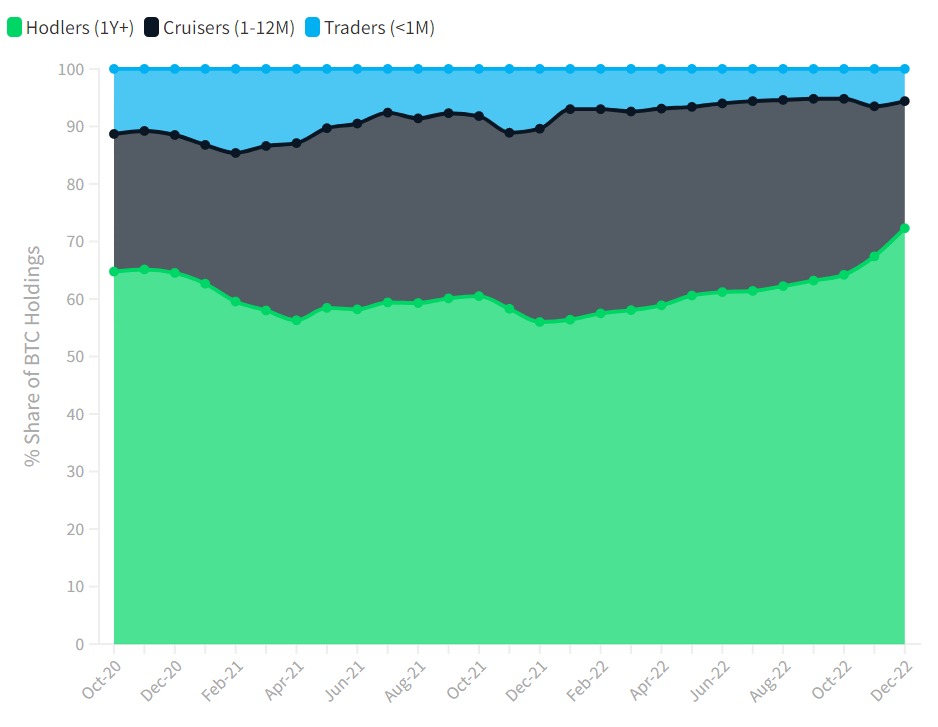
The percentage of short-term holders has meanwhile dropped to a multi-year low in October 2022, suggesting a “mean reversal is due with short-term traders likely to enter more BTC positions in the short to medium term.”
The report notes that BTC’s rally this year was seemingly the result of a short squeeze after a large number of short positions accelerated the rally while having to purchase back the assets they sold to cover their positions.
<!–
–> <!–
–>
On top of that, the macroeconomic environment has been improving, with inflation in the United States now having dropped for 6 months in a row, from 9.1% in June 2022 to 6.5% in December. In the European Union, inflation fell from 10.1% in November to 9.2% in December.
CryptoCompare’s report also notes that cryptocurrency markets saw “historically low volatility in the last quarter of 2022,” with Bitcoin’s average 30-day volatility being 53.3%. In the last five years, the firm noted, Bitcoin’s average 30-day volatility per quarter “has only been lower in Q3 and Q4 of 2020,” which suggests a return of volatility is warranted.
As CryptoGlobe reported, $BTC has recently seen a key technical indicator signal that the flagship cryptocurrency’s price has entered an uptrend for the first time since December 2021, when BTC dropped from around $50,000 to $43,000.
Earlier this week, a top cryptocurrency analyst that has gained a large following on social media after accurately in January 2018 bitcoin’s 84% decline throughout that year, from over $19,000 to a little over $3,000 in a year-long bear market, has suggested through two charts that there’s potential for Bitcoin to hit $150,000 by 2025.
Peter Brandt, who is one of the world’s most respected classical chartists, has shared charts on the microblogging platform Twitter with his nearly 700,000 followers that suggested $BTC is making an inverse head and shoulders pattern, which could push $BTC to $30,000 by the second quarter of this year.
Image Credit
Featured Image via Pixabay
- SEO Powered Content & PR Distribution. Get Amplified Today.
- Platoblockchain. Web3 Metaverse Intelligence. Knowledge Amplified. Access Here.
- Source: https://www.cryptoglobe.com/latest/2023/01/percentage-of-long-term-bicton-btc-holders-hits-new-high-data-shows/

