A historical pattern currently forming in a Bitcoin on-chain indicator could suggest that a top may be near for the asset, if not already in.
Bitcoin SOPR Ratio Is Forming A Historical Top Pattern Right Now
In een CryptoQuant Quicktake post, an analyst has discussed about a pattern regarding the SOPR Ratio. The “Winstverhouding uitgegeven output” (SOPR) is an indicator that tells us whether the Bitcoin investors are selling their coins at a profit or loss right now.
When the value of this metric is greater than 1, it means that profit-selling is dominant in the market currently. On the other hand, the metric being under the threshold suggests the average holder is moving coins at some net loss.
In the context of the current topic, the SOPR itself isn’t of interest; rather, it is a different version called the SOPR Ratio. The name may be a bit confusing as SOPR already contains a “ratio,” but the latter ratio here corresponds to the fact that this indicator compares the SOPR of two Bitcoin cohorts: the houders op lange termijn (LTHs) and korte termijn houders (STH's).
These investor groups make up for the two main divisions of the BTC market done based on holding time, with 155 days being the cutoff between the two. The STHs are those who bought within the past 155 days, while the LTHs include the HODLers carrying coins for longer than this timespan.
Now, here is a chart that shows the trend in the 7-day moving average (MA) of the Bitcoin SOPR Ratio over the history of the cryptocurrency:
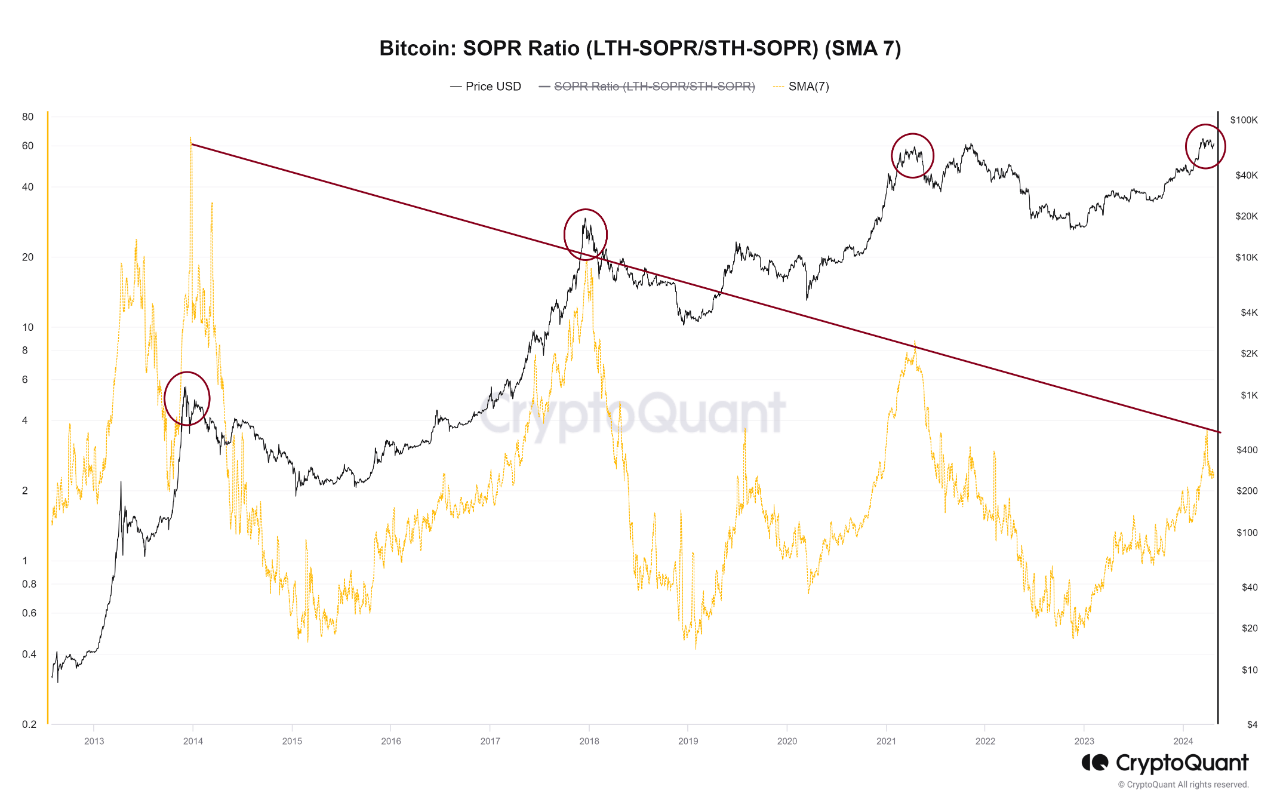
The 7-day MA value of the metric seems to have turned around towards the downside recently | Source: cryptoquant
As displayed in the above graph, the 7-day MA Bitcoin SOPR Ratio had been heading up throughout 2023 and early parts of 2024, but recently, the metric has hit a top and reversed its direction. Whenever the SOPR Ratio is higher than 1, it means the LTHs, who are generally known to be resolute hands, are participating in a higher degree of profit-taking than the STHs.
It would appear that as BTC had observed its rally and approached a new all-time high (ATH), these diamond hands had started harvesting some of the gains they had earned over their long holding time. And once the price set a new ATH, these investors participated in peak profit-taking. Since then, their profit-selling has been dropping off, although they are still harvesting notably higher gains than the STHs.
In the chart, the analyst highlights how this pattern has been repeated at different points in the asset’s history. While the scale of the peak LTH profit-taking has been heading down over the cycles, it’s still true that the metric’s top has coincided with tops in the price during each of them.
As the line drawn by the quant suggests, it’s possible that the latest peak in the metric may have in fact been the top for this cycle. This is only, however, assuming that the pattern of diminishing returns in the indicator holds to the exact degree judged by the line.
It’s possible that the peak will still be higher than the current levels, while at the same time being lower than the previous cycle’s peak, thus still being in-line with the historical Bitcoin pattern.
Whatever the case be, though, the fact that the SOPR ratio has apparently hit a top could still be a bearish signal, if only in the short term.
BTC-prijs
Bitcoin has been making some steady recovery over the last few days as its price has now surged back above $66,100.
Looks like the price of the asset has been going up over the last few days | Source: BTCUSD op TradingView
Uitgelichte afbeelding van Maxim Hopman op Unsplash.com, CryptoQuant.com, grafiek van TradingView.com
Disclaimer: het artikel is uitsluitend bedoeld voor educatieve doeleinden. Het vertegenwoordigt niet de mening van NewsBTC over het kopen, verkopen of aanhouden van beleggingen en uiteraard brengt beleggen risico's met zich mee. U wordt geadviseerd om uw eigen onderzoek uit te voeren voordat u beleggingsbeslissingen neemt. Gebruik de informatie op deze website geheel op eigen risico.
- Door SEO aangedreven content en PR-distributie. Word vandaag nog versterkt.
- PlatoData.Network Verticale generatieve AI. Versterk jezelf. Toegang hier.
- PlatoAiStream. Web3-intelligentie. Kennis versterkt. Toegang hier.
- PlatoESG. carbon, CleanTech, Energie, Milieu, Zonne, Afvalbeheer. Toegang hier.
- Plato Gezondheid. Intelligentie op het gebied van biotech en klinische proeven. Toegang hier.
- Bron: https://www.newsbtc.com/bitcoin-news/bitcoin-top-already-historical-pattern-so/

