Executive Summary
- Bitcoin prices have pulled back -15.4% from the new $73k ATH, reaching as low as $61k. This price action aligns very closely with the prior 2018-21 cycle.
- Several on-chain indicators have flagged an uptick in profit taking events, with over $2.6B in realized profit taken as the market reached resistance.
- The overall Bitcoin market has several similarities to prior ATH breakouts, specifically related to distribution pressure by the Long-Term Holder cohort.
The Bitcoin market has taken a breather from the powerful uptrend over the last two weeks, and has corrected and consolidated above $61k. BTC prices pulled back -15.4% from the new $73.1k ATH set on 13-March, trading down to a local low of $61.8k on 20-March, before recovering back to $70k.
If we index price performance (black) since the April 2021 ATH (where we argue bear market sentiment set in), we can see a remarkable similarity to the prior cycle (blue). By both duration and distance from the April 2021 peak, the market is in a near identical spot to December 2020 relative to the 2018-21 cycle.

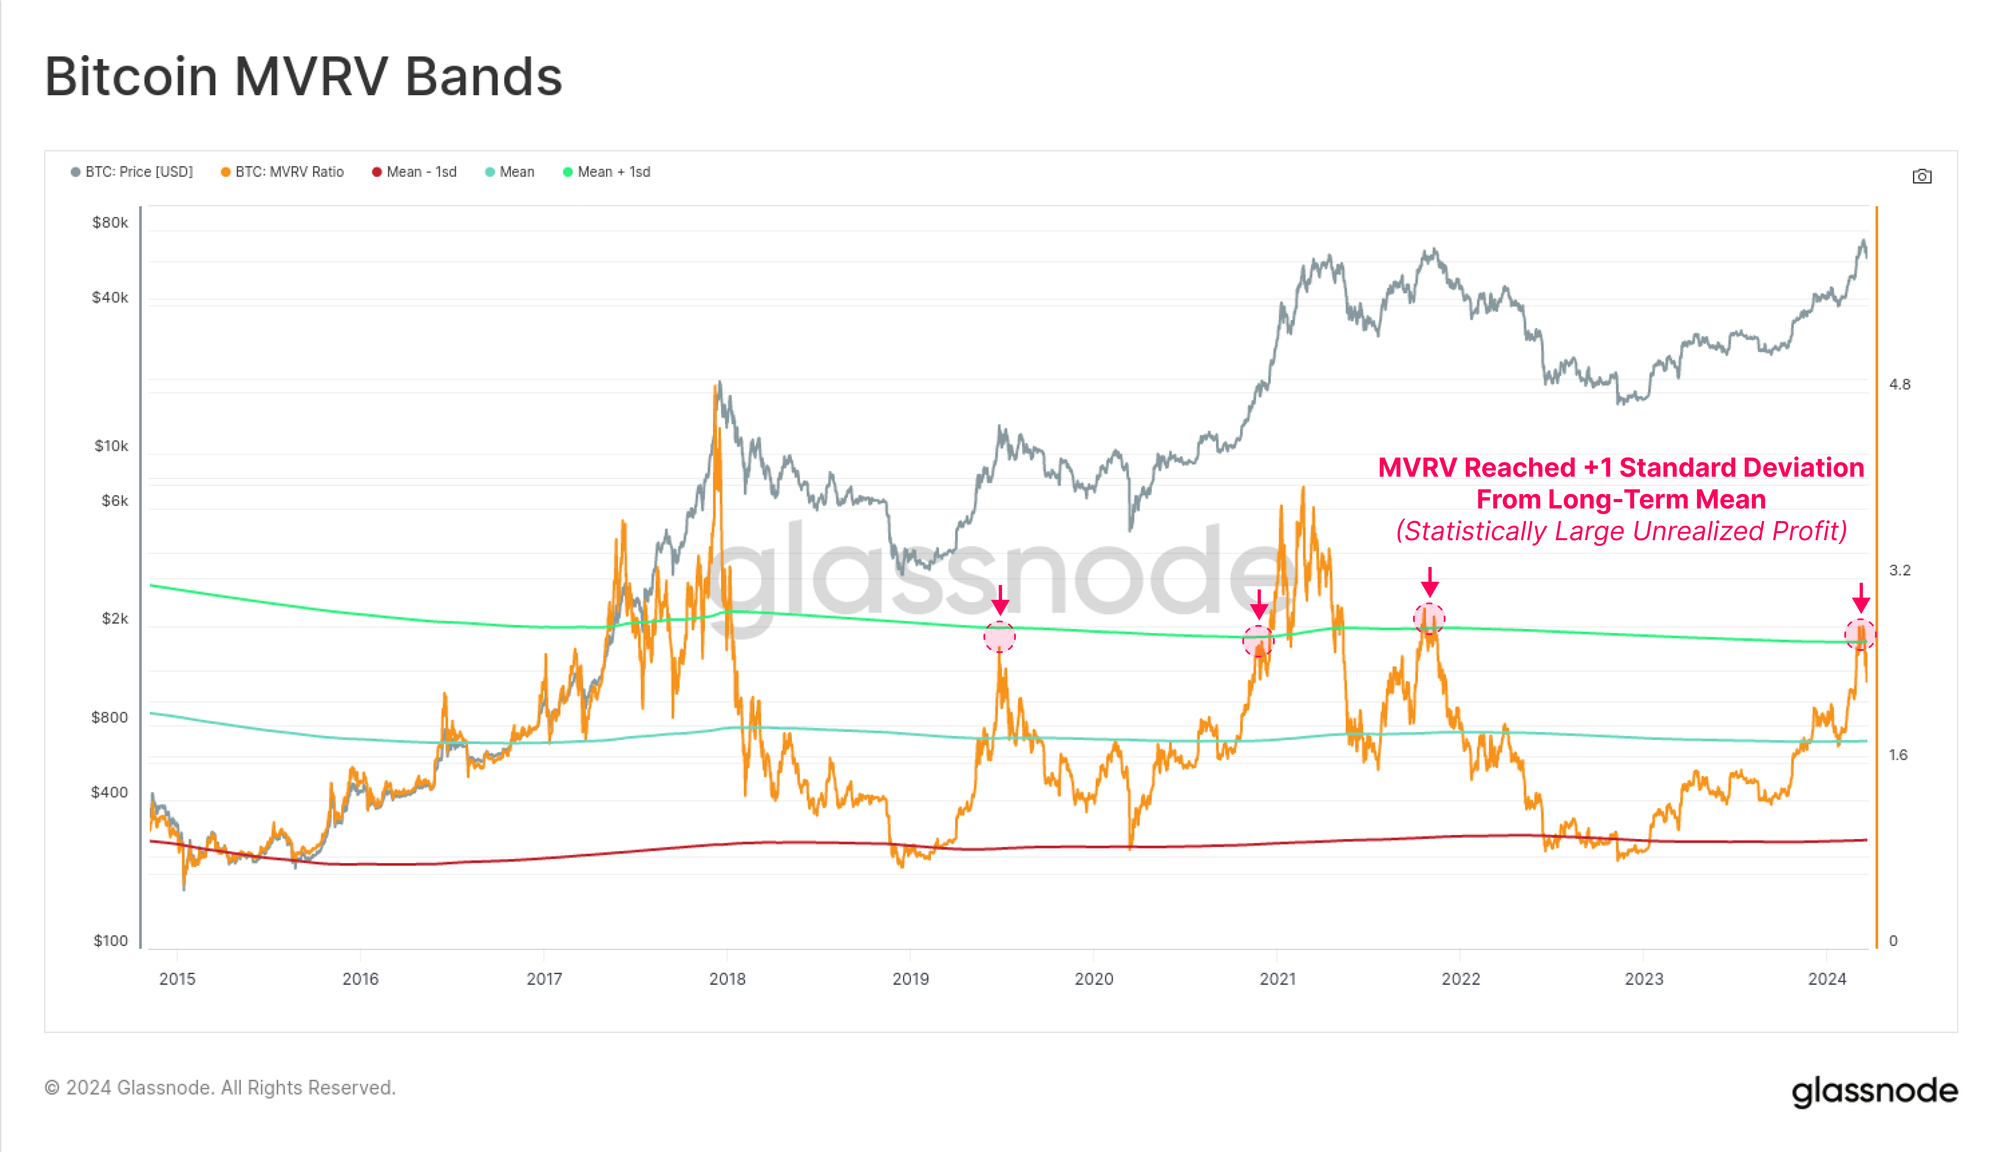
Í okkar video report from last week, we explored how the Bitcoin market had reached several statistically significant levels with respect to Unrealized profit held within the supply. Metrics like MVRV and the AVIV Ratio reached +1 standard deviation from their long-term means.
Past instances have historically been points of interest, where the market finds a degree of resistance, and some investors start to take profits and chips off the table.
As prices traded down from the ATH and to recent low of $61.2k, a total of 2.0M BTC switched from a status of being ‘in-profit’ to being ‘in-loss’. This provides an indication of the volume of coins that have transacted at a new elevated cost basis.
As the market bounced back to $66.5k, around 1.0M coins returned to ‘in-profit’ status. From these two observations, we can determine that:
- Around 1.0M BTC have a cost basis between $61.2k and $66.5k.
- Around 1.0M BTC have a cost basis between $66.5k and the ATH at $73.2k.
This is one of the larger ‘supply clusters’ encountered during pullbacks since the 2022 lows, suggesting an acceleration of on-chain coin volumes over recent months.
💡

Taking Chips Off the Table
A majority of these 2.0M BTC which now have a cost basis above $61.2k have recently changed hands, with the prior owner spending them to lock in a profit. The chart below presents a suite of variants for the SOPR metric which describes this realized profit behavior.
SOPR describes the average realized profit/loss multiple locked in by the cohort considered, and is the ‘spent’ sibling of MVRV (which is ‘unspent’, measuring the average unrealized profit/loss). All four variants have pushed to relative highs, with our Entity-Adjusted variant approaching levels seen at the height of the 2021 bull market.
This indicates that the market is accelerating their volume and magnitude of profit taking in spot markets.

As the market reached the $73.2k ATH, over $2.6B in Realized profit was locked in via on-chain spending. Approximately 40% of this profit taking can be attributed to the Long-Term, Holder cohort, which includes investors divesting from the GBTC Trust.
The remaining $1.56B in Realized profit was locked in by Short-Term Holders, as traders take advantage of the inflowing liquidity and market momentum. Realized profit by both cohorts has reached a similar magnitude to during the 2021 bull market peak.

We can also see the dominance of Long-Term Holders is increasing relative to all profit taking events. This aligns with our prior report (WoC-11) where we noted an uptick in LTH spending as the market broke to new ATHs.
This behaviour pattern is typical of all prior Bitcoin cycles which we documented in a prior report; Eftir snjallpeningana From this, analysts can start to consider LTHs as an increasingly important cohort when assessing the magnitude of sell-side supply pressure moving forwards.

Finally, we can consult a somewhat attractive chart which plots out supply clusters over time and by coin age. We have highlighted in blue previous breaks to a new ATH price, catalysing a distinct transition towards ‘red hot supply’.
These warmer colors indicate that a large proportion of older supply has started to transact, change hands, and be revalued up to the current spot price. We can see that this tends to characterise the ‘Euphoria Phase’ of prior Bitcoin bull markets, and thus far very similar patterns are playing out.
From this, we can conclude that higher prices tend to active more dormant supply, bringing older illiquid supply back into liquid circulation. This reflects a wealth transfer event, where long-term holders distribute supply for a profit, and satisfy the new inflowing waves of demand.

Samantekt og ályktanir
The Bitcoin market has rallied to a new ATH above $73k, triggering an uptick in profit taking events by the Long-Term Holder cohort. The market is currently seeing over $2.6B/day in realized profit, suggesting many investors have started to take chips off the table. This is not atypical market behaviour however, and aligns very closely with market patterns observed during all prior cycle ATH breakouts.
Fyrirvari: Þessi skýrsla veitir enga fjárfestingarráðgjöf. Öll gögn eru eingöngu veitt í upplýsinga- og fræðslutilgangi. Engin fjárfestingarákvörðun skal byggjast á þeim upplýsingum sem hér eru gefnar og þú berð einn ábyrgð á þínum eigin fjárfestingarákvörðunum.
Skiptistöður sem kynntir eru eru fengnir úr yfirgripsmiklum gagnagrunni Glassnode með heimilisfangamerkjum, sem safnað er saman með bæði opinberum útgefnum skiptiupplýsingum og sérkennum þyrpingaralgrímum. Þó að við leitumst við að tryggja fyllstu nákvæmni í framsetningu gjaldeyrisjöfnuða, þá er mikilvægt að hafa í huga að þessar tölur gætu ekki alltaf innifalið allan varasjóð kauphallar, sérstaklega þegar kauphallir forðast að gefa upp opinber heimilisföng sín. Við hvetjum notendur til að sýna aðgát og gætni þegar þeir nota þessar mælingar. Glassnode ber ekki ábyrgð á neinu misræmi eða hugsanlegri ónákvæmni. Vinsamlegast lestu gagnsæistilkynningu okkar þegar þú notar skiptigögn.

- SEO knúið efni og PR dreifing. Fáðu magnara í dag.
- PlatoData.Network Vertical Generative Ai. Styrktu sjálfan þig. Aðgangur hér.
- PlatoAiStream. Web3 upplýsingaöflun. Þekking aukin. Aðgangur hér.
- PlatóESG. Kolefni, CleanTech, Orka, Umhverfi, Sól, Úrgangsstjórnun. Aðgangur hér.
- PlatoHealth. Líftækni og klínísk rannsóknagreind. Aðgangur hér.
- Heimild: https://insights.glassnode.com/the-week-onchain-week-13-2024/

