- The S&P 500 has recorded three consecutive weekly losses since its recent all-time high level of 5,265 printed on 28 March 2024.
- Last week’s decline of -3.05% was its worst weekly performance since early March 2023.
- A clear break below its upward-sloping 50-day moving average put its medium-term uptrend phase in jeopardy.
- The current multi-week corrective decline sequence may be extended further as its key market breadth indicator (% of component stocks above 50-day moving average) has not reached an oversold region.
- Watch the first key medium-term support at 4,800 on the S&P 500.
Þetta er framhaldsgreining á fyrri skýrslu okkar, “SPX 500: Fed dovish pivot narrative is at risk” published on 8 April 2024. Click hér til upprifjunar.
The price actions of the S&P 500 have tumbled by -5.95% from its current all-time high of 5,265 on 28 March 2024 to hit a recent low of 4,953 last Friday, 19 April coupled with a break below its 50-day moving average that previously supported the S&P 500 from 3 November 2023 to 15 April 2024.
A clear break below an upward-sloping 50-day moving average after a lengthy period acting as support for its price actions, suggesting that the medium-term uptrend of the S&P 500 from its 27 October 2023 low of 4,104 is in jeopardy of transiting into a multi-week corrective decline sequence. In addition, last Friday’s weekly decline of -3.05% has been its worst weekly performance since 6 March 2023.
The weak state of market breadth on the S&P 500 has not hit an oversold region
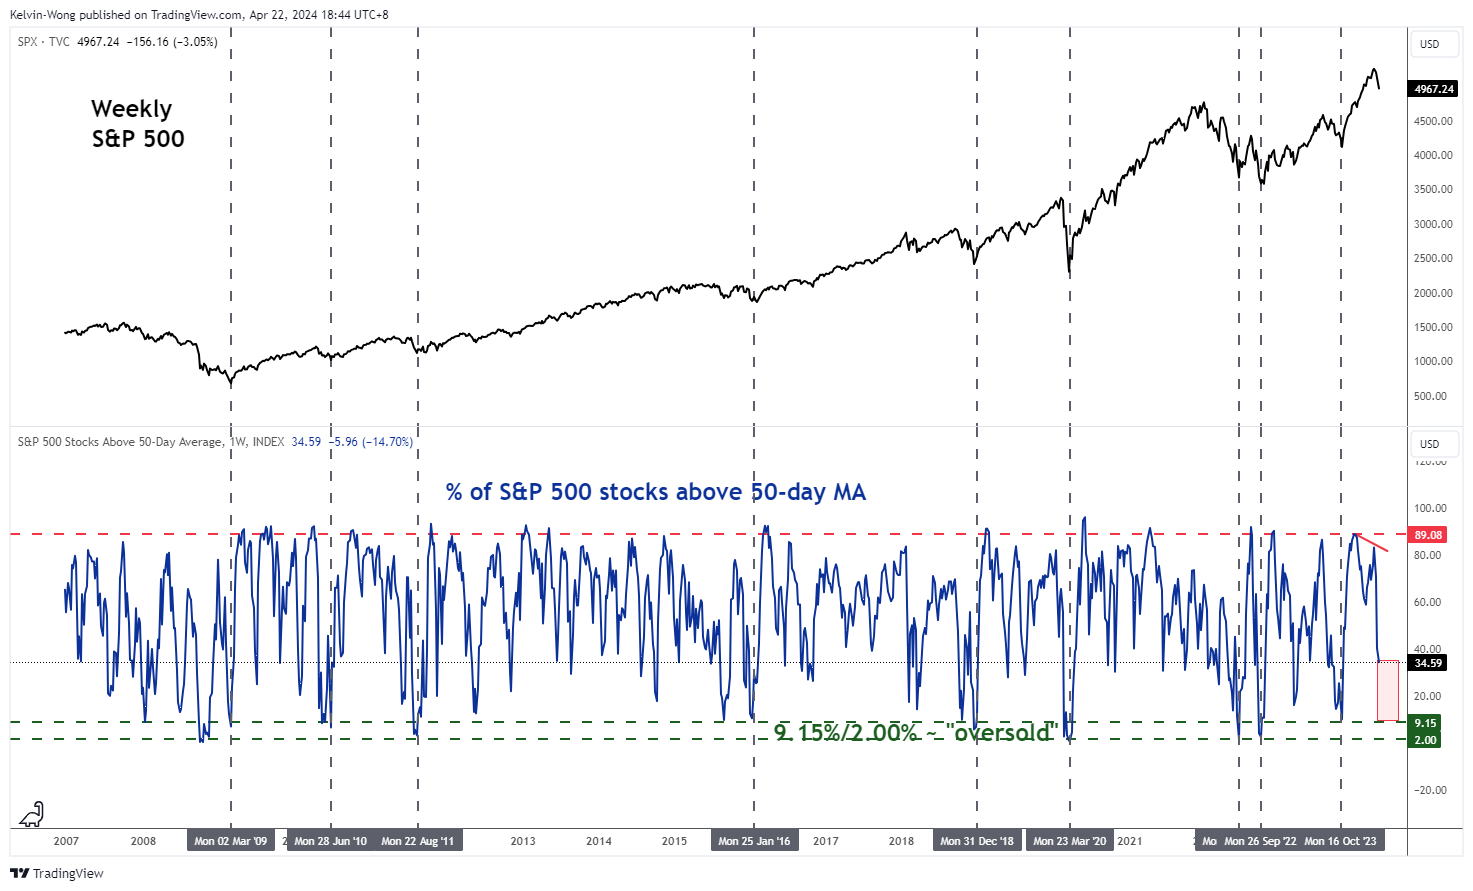
Fig 1: Market breadth indicator of S&P 500 as of 19 Apr 2024 (Source: TradingView, click to enlarge chart)
The percentage of S&P 500 component stocks that are trading above their respective 50-day moving averages has plummeted after a bearish divergence condition flashed on the week of 25 March 2024 at around 71% to hit the 35% level as of last Friday, 19 April.
Based on historical data since the start of the ongoing long-term secular uptrend phase of the S&P 500 from March 2009, prior medium-term corrective down move sequences tend to end when the market breadth indicator (percentage of S&P 500 stocks above 50-day moving averages) hit an oversold level of between 9.15% to 2% (see Fig 1).
Hence, we have not reached such a “capitulation condition” yet for a potential significant bullish reversal trigger on the S&P 500.
The weekly RSI momentum indicator of the S&P 500 has not reached a parallel support
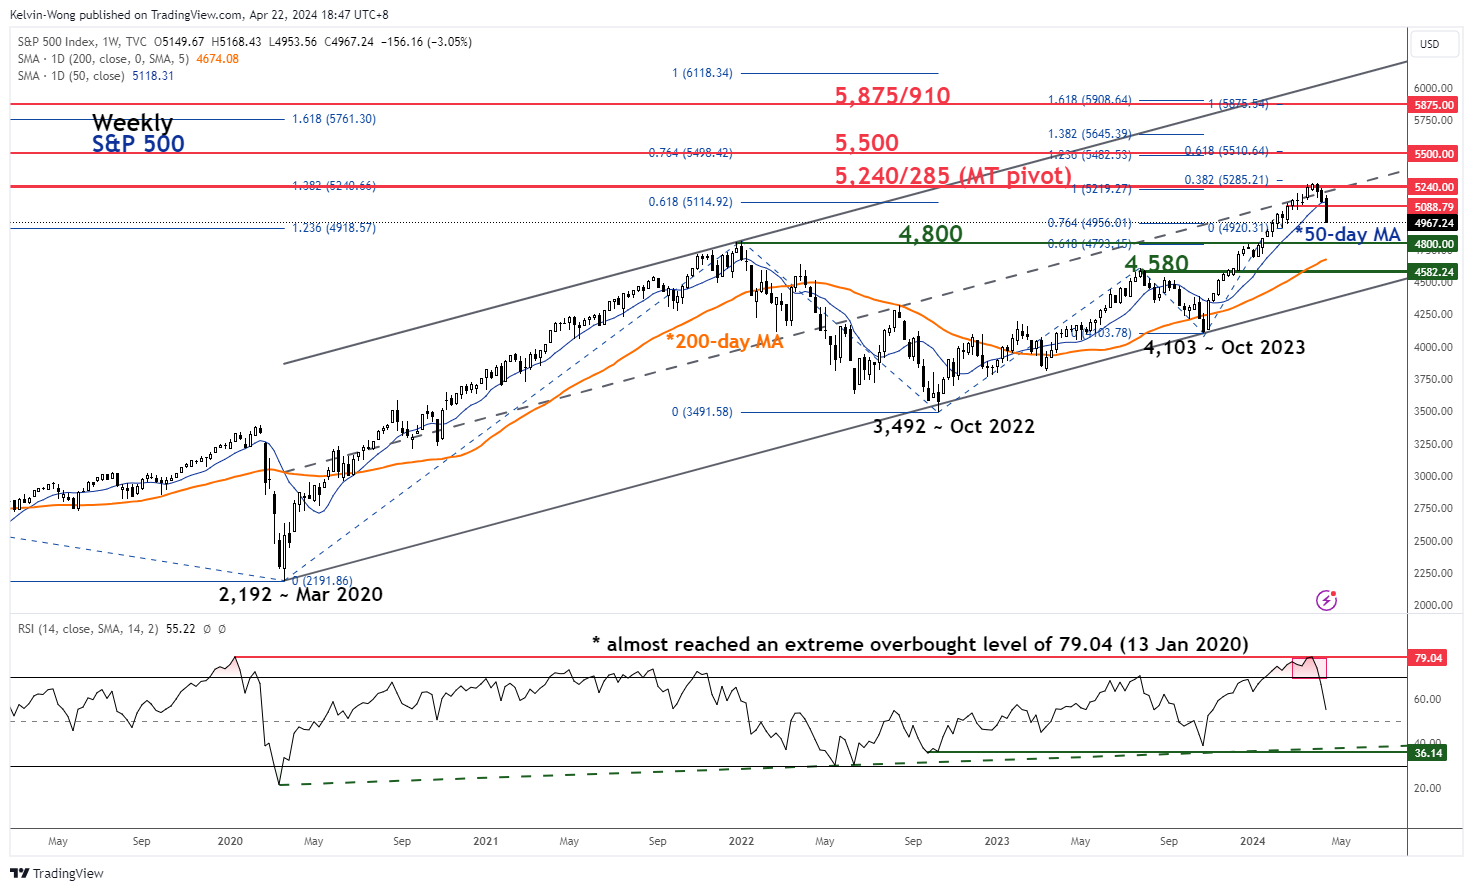
Fig 2: S&P 500 major trend as of 19 Apr 2024 (Source: TradingView, click to enlarge chart)
The recent three weeks of corrective decline have taken form right after the S&P 500 hit the 5,240/5,285 medium-term pivotal resistance zone (see Fig 2).
Thereafter, the weekly RSI momentum indicator exited from its overbought level (below 70) after an extreme overbought level of 79.04 was almost met on the week of 25 March 2024. The current reading of 55 has not reached a key parallel support of 36 which suggests that the current 5.95% corrective decline of the S&P 500 from its all-time high may still have room to extend further to the downside.
The first medium-term support of the S&P 500 to watch will be at the 4,800 level with intermediate resistance now at 5,088
Efnið er eingöngu ætlað til almennra upplýsinga. Það er ekki fjárfestingarráðgjöf eða lausn að kaupa eða selja verðbréf. Skoðanir eru höfundar; ekki endilega hjá OANDA Business Information & Services, Inc. eða einhverju af hlutdeildarfélögum þess, dótturfyrirtækjum, yfirmönnum eða stjórnarmönnum. Ef þú vilt endurskapa eða endurdreifa einhverju af efninu sem er að finna á MarketPulse, margverðlaunuðu gjaldeyris-, hrávöru- og alþjóðlegum vísitölumgreiningu og fréttasíðuþjónustu framleidd af OANDA Business Information & Services, Inc., vinsamlegast opnaðu RSS strauminn eða hafðu samband við okkur á [netvarið]. Heimsókn https://www.marketpulse.com/ til að fá frekari upplýsingar um taktinn á alþjóðlegum mörkuðum. © 2023 OANDA Business Information & Services Inc.
Kelvin Wong hefur brennandi áhuga á að tengja punktana á fjármálamörkuðum og deila sjónarhornum í kringum viðskipti og fjárfestingar. Kelvin Wong er sérfræðingur í að nota einstaka blöndu af grundvallar- og tæknigreiningum, sem sérhæfir sig í Elliott Wave og sjóðstreymisstaðsetningu, til að ákvarða helstu viðsnúningastig í fjármálakerfinu. mörkuðum.
Að auki, á síðustu tíu árum, hefur Kelvin haldið fjölmargar markaðshorfur og viðskiptatengdar málstofur, auk tæknigreiningarnámskeiða, fyrir þúsundir smásöluaðila.
Nýjustu færslur eftir Kelvin Wong (sjá allt)
- SEO knúið efni og PR dreifing. Fáðu magnara í dag.
- PlatoData.Network Vertical Generative Ai. Styrktu sjálfan þig. Aðgangur hér.
- PlatoAiStream. Web3 upplýsingaöflun. Þekking aukin. Aðgangur hér.
- PlatóESG. Kolefni, CleanTech, Orka, Umhverfi, Sól, Úrgangsstjórnun. Aðgangur hér.
- PlatoHealth. Líftækni og klínísk rannsóknagreind. Aðgangur hér.
- Heimild: https://www.marketpulse.com/indices/spx-500-how-low-can-the-correction-go/kwong

