Join Our Telegram channel to stay up to date on breaking news coverage
The Huobi Token (HT) price prediction kicked off its rally with a break above the key resistance level of $7.5 as the coin spikes higher.
Huobi Token Prediction Statistics Data:
- Huobi Token price now – $7.66
- Huobi Token market cap – $1.1 billion
- Huobi Token circulating supply – 153.3 million
- Huobi Token total supply – 500 million
- Huobi Token Coinmarketcap ranking – #43
HT/USD Long-term Trend: Bullish (Daily Chart)
Key Levels:
Resistance levels: $10.0, $10.5, $11.0
Support levels: $5.5, $5.0, $4.5
According to the daily chart, HT/USD has been experiencing significant boosts that keep the coin above the 9-day and 21-day moving averages. The current performance of the coin indicates the addition of an upward movement within the channel. More so, it’s just a matter of time for the Huobi Token price reaches another resistance level of $8.0 level if it continues to follow the positive direction.
Huobi Token Price Prediction: What to Expect from Huobi Token
Since the beginning of this month, the Huobi Token price has moved from around $4.0, touching the monthly high at $8.0, and at the same time moving to cross above the upper boundary of the channel. The ongoing trend may move a little bit higher in the next positive direction, and the coin could reach the nearest resistance at $8.0. However, if the buyers put more effort, HT/USD could hit additional resistance levels at $10.0, $10.5, and $11.0 respectively.
Meanwhile, if the coin crosses below the 9-day moving average, a bearish drop may roll the market back to the downside and the initial support level of $6.0 could be reached. Moreover, any further bearish movement could hit the critical supports at $5.5, $5.0, and $4.5. More so, the technical indicator Relative Strength Index (14) is seen moving within the overbought region, and this could still supply more bullish signals into the market.
HT/USD Medium-term Trend: Ranging (4H Chart)
Looking at the 4-hour chart, Huobi Token is trading above the 9-day and 21-day moving averages as the price hovers around $7.7. The technical indicator Relative Strength Index (14) is likely to cross above the 60-level as the signal line faces the north. However, the daily chart reveals that the buyers may continue to dominate the market if the market price rises above the resistance level of $8.0.
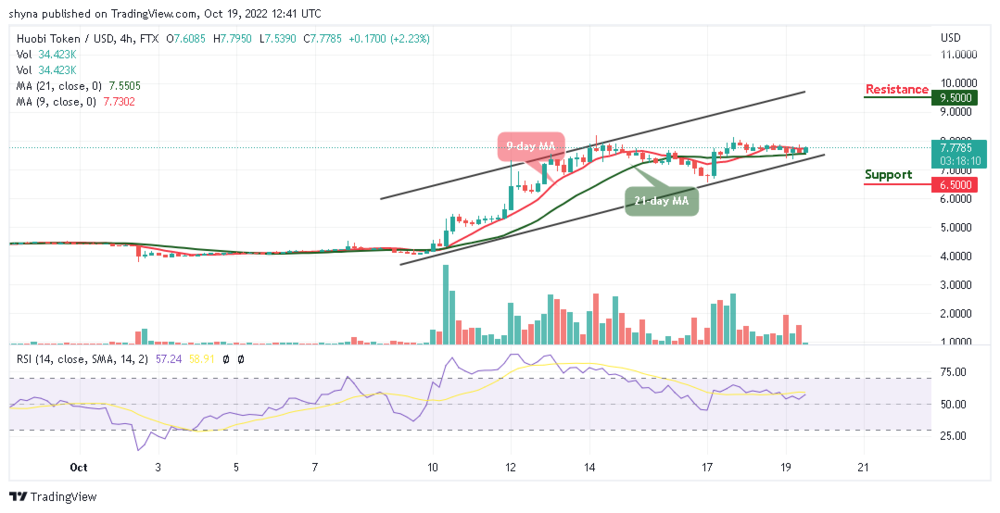
Nevertheless, the potential resistance level could be located at $9.5 and above. Conversely, a lower sustainable move may likely cancel the bullish pattern, and it could attract new sellers to the market, which could bring the HT/USD below the lower boundary of the channel to hit the support level of $6.5 and below.
One alternative to Bitcoin is the IMPT token, which is on presale now at the link below and has raised $4.5 million so far.
IMPT – New Green Crypto
- Early Stage Presale Live Now
- Doxxed Professional Team
- Use Cases in Industry – Offset Carbon Footprint
Related:
Join Our Telegram channel to stay up to date on breaking news coverage

