Introduction
Until recently, gerrymandered districts tended to stick out, identifiable by their contorted tendrils. This is no longer the case. “With modern technology, you can gerrymander pretty effectively without making your shapes very weird,” said Beth Malmskog, a mathematician at Colorado College. This makes it that much harder to figure out whether a map has been unfairly manipulated.
Without the telltale sign of an obviously misshapen district to go by, mathematicians have been developing increasingly powerful statistical methods for finding gerrymanders. These work by comparing a map to an ensemble of thousands or millions of possible maps. If the map results in noticeably more seats for Democrats or Republicans than would be expected from an average map, this is a sign that something fishy might have taken place.
But making such ensembles is trickier than it sounds, because it isn’t feasible to consider all possible maps — there are simply too many combinations for any supercomputer to count. A number of recent mathematical advances suggest ways to navigate this impossibly large space of possible simulations, giving mathematicians a reliable way to tell fair from unfair.
Like so many things related to redistricting, their work is ending up in court. In the last five years, simulations have been accepted as evidence in redistricting court cases in Missouri, North Carolina, Ohio and Michigan. And they are the central objects of debate in Allen v. Milligan, a crucial case pending before the Supreme Court in which Black voters accuse the state of Alabama of drawing its Congressional district map to disadvantage them. In this case, as in many others, simulations are being enlisted by both the plaintiffs and the defendants to plead their case. The Court is expected to issue a decision in June or July.
But, as one of the plaintiffs’ lawyers told Justice Samuel Alito in oral arguments in October, “the simulations actually generate more questions than they answer.”
Combinatorial Explosion
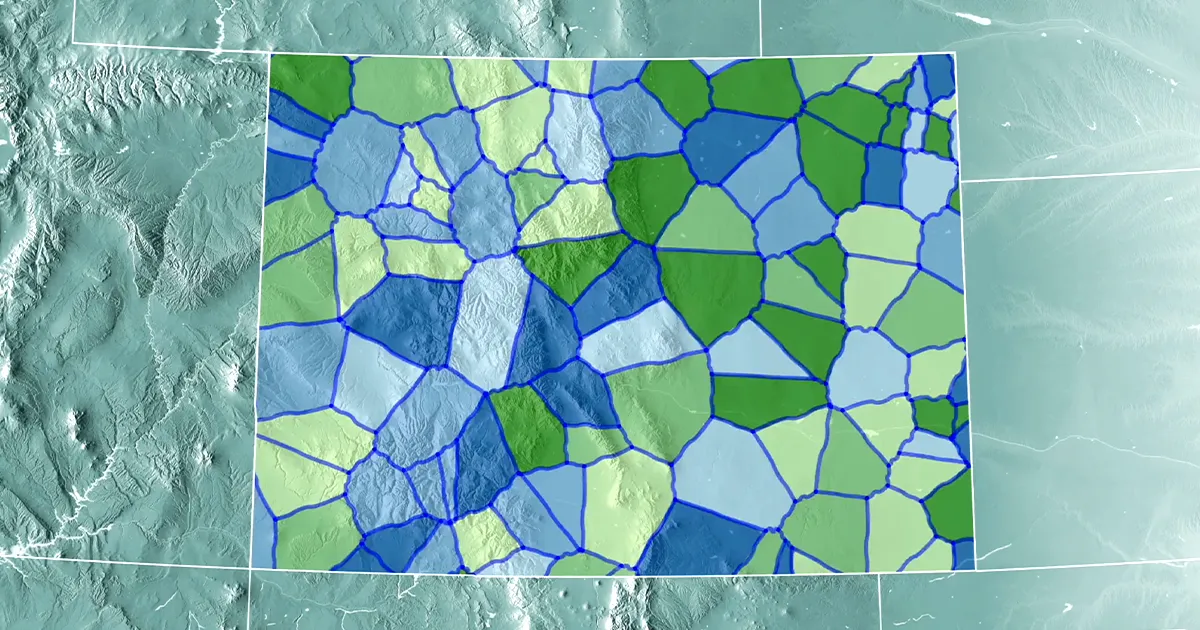
To understand the mathematical difficulty in generating an ensemble, start by thinking of unrealistically simple maps. Imagine, for example, a 4-by-4 grid. There are 117 different ways to subdivide these 16 squares into four contiguous districts with four squares per district. From there, the possibilities grow very quickly in what’s known as a combinatorial explosion. A 6-by-6 grid with six contiguous districts of six squares each has 451,206 possibilities. A 9-by-9 grid with nine districts of nine squares each? Over 700 trillion options. For a 10-by-10 grid, with 100 squares, nobody knows how many possible 10-district configurations there are.
Of course, a typical state has many more than 100 different jurisdictions that can be grouped together into districts. Analysts often build possible districts out of voting precincts. North Carolina has over 2,500 precincts, for example, while Pennsylvania has 9,159. Official districting plans are generally based on even more granular census blocks: Alabama has 185,976 such blocks.
Every state has different rules for drawing districts, but in general, they must be contiguous and “compact,” preserve traditional geographic and political boundaries, be very close to equal in population, and avoid breaking apart so-called communities of interest. The Voting Rights Act also requires that districts be drawn in a way that ensures that voters of all racial groups get an equal chance to “elect representatives of their choice.” Reconciling all these requirements is mathematically challenging. The more requirements there are on redistricting, Malmskog said, “the more complicated the mathematical problem becomes.”
For the last 20 years, the dominant technique for generating lots of possible maps has been a technique called “random seed and grow.” This works much the way it sounds. Say you want to combine thousands of individual voting precincts into, say, 10 congressional districts, each of which must include about 760,000 people. You start by randomly choosing a precinct to “seed” a particular district. You then add adjacent precincts to this seed until you get close to 760,000 people in the district. Then you repeat the process — start with another precinct to seed another district — until you come up with the rest of your districts.
With some relatively simple tweaks to make sure the districts are compact, it’s possible to use this method to make lots of reasonable-looking maps. But because of the combinatorial explosion in the number of possible maps, even millions of maps made by the random-seed-and-grow technique account for only a tiny fraction of all possible maps. And there is no mathematical evidence that this fraction is representative of the set of valid maps as a whole, which means using it as a basis of comparison can lead to misleading conclusions.
That’s why, in the middle of the past decade, researchers including Kosuke Imai, a professor of government and statistics at Harvard University, and Jonathan Mattingly, a professor of mathematics and statistics at Duke University, began applying a technique called Markov chain Monte Carlo, or MCMC, to make maps.
MCMC works by first transforming the existing district map into a graph — a mathematical structure consisting of nodes, or points, connected by lines, or edges. Each precinct becomes a node; if precincts share a border in real life, they are joined by an edge in the graph. Early MCMC methods, like the “flip-based” method described by Imai and colleagues in a 2014 paper, worked by swapping precincts between bordering districts in a mathematically specific way.
By thinking of their map as a graph, researchers can use a tool from graph theory called the Perron-Frobenius theorem to show that, if the algorithm is allowed to run for long enough — an interval that mathematicians call the mixing time — it will properly sample from the distribution of all possible valid maps. This is an improvement, but it is still usually impossible to rigorously prove exactly how long the mixing time is. Mattingly said the question of how best to “prove to everyone that we did a good job sampling” remains unresolved. So mathematicians are working on tweaks to MCMC to better establish bounds on the mixing time — and to reach it more quickly.
Introduction
One advance came in 2019, when a group of researchers was working on a better way to draw a new district map for the Virginia House of Delegates. The previous year, a federal court had ruled that 11 districts in Virginia’s map were unconstitutional because they concentrated Black residents in a way that diluted their voting strength. Furthermore, Virginia has an unusually strict constraint in its redistricting process: Districts can only deviate in population by 1%. Given that there are 100 state House districts, “that’s a pretty tight bound,” said Daryl DeFord, a mathematician at Washington State University who analyzed the fairness of the Virginia map. It meant that the group couldn’t work at the level of precincts. “Some precincts were basically too big to make a valid plan,” DeFord said. Partitioning the map into smaller census block units didn’t work either. After around 10 million steps, standard flip-based MCMC algorithms “weren’t anywhere close to having representative samples from the whole space,” he said.
So DeFord and his colleagues came up with a way to move through the space more quickly. In order to speedily obtain samples from the entire space of possible maps, they needed to change the district assignment for many precincts at once in a way that preserved the contiguity of the districts. This made each step in the Markov chain more computationally expensive, but it also meant that each step brought them that much closer to the mixing time.
They devised an algorithm called ReCom that works by randomly selecting two adjacent districts and merging them to create a single unit. This unit inherits the graph structure that each district had. But instead of swapping adjacent precincts, ReCom randomly creates a new graph called a spanning tree that connects the nodes in the two combined districts (each one representing a precinct) to one another in a way that doesn’t contain any loops but ensures that all the nodes are connected. Because there are no loops, cutting any one edge would then split the two combined districts back into two parts (just as sawing off any branch of a tree would cut it into exactly two parts).
It’s usually easy to find edges that leave a nearly equal number of nodes in each of the resulting components — ReCom randomly chooses such an edge. (If it can’t find one, it redraws the spanning tree.) Because of the statistics of spanning trees, this also has a natural tendency to produce compact districts. Because ReCom imposes hundreds of changes at each step, its inventors believe it reaches the mixing time more quickly than flip-based methods that change fewer precincts at a time.
Real-World Challenges
Virginia’s tight population constraint isn’t the only possible twist in the process. Colorado has an unusual requirement beyond the typical constraints of contiguity and compactness: Colorado law also requires that districts be “competitive.”
The law only vaguely defines competitiveness, so the independent commission in charge of drawing Colorado’s state legislative district map decided to define a competitive district using historical data. For a hypothetical district to be “competitive,” the vote total for selected races over the previous three election cycles, for both Democrats and Republicans, had to be between 46% and 54%.
The commission then turned to DeFord, Malmskog and Jeanne Clelland, a mathematician at the University of Colorado, Boulder, along with Flavia Sancier-Barbosa, a colleague of Malmskog’s at Colorado College. The four researchers used the ReCom algorithm to generate ensembles of millions of maps that followed the state’s redistricting criteria; they then used those ensembles to figure out a “range of values for how many districts you might expect to fall into that competitive range,” Clelland said. Then, as the commission drew new plans, the mathematicians determined where they fell within the statistical analysis. In the end, the legislative redistricting commission selected a map that had more competitive districts than the average that the mathematicians saw in their ensembles, Clelland said.
Clelland noted that while competitive districts might sound fair, in practice they can conflict with proportionality, the goal that the number of representatives from either party should match the number of voters in that party statewide. “If you have a whole lot of districts where the result is really close to 50%, then a very small change in the fraction of the vote share could make a very big change in the fraction of the seat share.”
Introduction
Imai said he is concerned that in certain cases, MCMC methods such as ReCom that start from an initial plan and tweak it “have a hard time exploring the space.” Since the space of possible valid maps is very multimodal, he said (meaning that there can be multiple good solutions that are very different from one another), such algorithms might risk staying too close to their initial conditions. That’s why, together with his graduate student Cory McCartan, Imai introduced a new method called “sequential Monte Carlo,” or SMC, in a preprint that has been accepted for publication in the Annals of Applied Statistics. SMC also translates maps into graphs and, like ReCom, creates spanning trees of these graphs.
SMC creates a single spanning tree that includes a node for every precinct. It then attempts to split off just one district from the rest of the graph. It identifies the most promising edges to cut based on criteria that Imai and McCartan specify, and then it randomly chooses one of these edges. It then repeats the process on the remaining part of the graph, splitting off one new district at a time until the requisite number of districts have been created. By repeating this process millions of times, SMC creates millions of possible viable maps.
Mathematical Arguments
Computational redistricting effectively replaces the comparatively straightforward question of whether a single map is fair with the seemingly far more complicated one of whether millions of maps are fair. This places it squarely in the mathematical tradition of showing that a simple problem is equivalent to a far more complicated one, and then solving the more complicated problem.
In November 2022, Imai’s team released a massive collection of congressional redistricting map simulations for all 50 states based on data from the 2020 census. Since there are many parameters to tweak, depending on what question you’re trying to answer, their hope is that their tool will make ensemble analysis available to the masses.
Imai is an expert witness for the plaintiffs in the pending Supreme Court case. The plaintiffs are arguing, using the ensembles he generated, that Alabama’s districts violate the Voting Rights Act by disenfranchising Black voters. But the state of Alabama, which is being sued, is using his ensembles to argue that the map is fairly drawn. Whatever the court decides, it shows that, when it comes to elections, mathematics will always need to contend with politics.
- SEO Powered Content & PR Distribution. Get Amplified Today.
- PlatoAiStream. Web3 Data Intelligence. Knowledge Amplified. Access Here.
- Minting the Future w Adryenn Ashley. Access Here.
- Buy and Sell Shares in PRE-IPO Companies with PREIPO®. Access Here.
- Source: https://www.quantamagazine.org/how-math-has-changed-the-shape-of-gerrymandering-20230601/

