Ethereum price started a fresh increase from the $1,900 support. ETH is now facing resistance near $2,020, above which it could accelerate higher.
- Ethereum found support near $1,900 and started a decent increase.
- The price is trading above $1,980 and the 100-hourly Simple Moving Average.
- There is a major bearish trend line forming with resistance near $2,020 on the hourly chart of ETH/USD (data feed via Kraken).
- The pair could start a strong increase if it clears the $2,020 resistance zone.
Ethereum Price Faces Hurdles
This past week, Ethereum price started a downside correction from the $2,120 resistance. ETH declined below the $2,020 and $2,000 support levels. It even spiked below the $1,920 support.
A low was formed near $1,905 and the price started a steady increase, like Bitcoin. There was a move above the $1,950 and $1,980 resistance levels. The bulls pushed the price above the 50% Fib retracement level of the downward move from the $2,092 swing high to the $1,905 low.
Ethereum is now trading above $1,980 and the 100-hourly Simple Moving Average. On the upside, the price is facing resistance near the $2,020 zone.
There is also a major bearish trend line forming with resistance near $2,020 on the hourly chart of ETH/USD. The trend line is near the 61.8% Fib retracement level of the downward move from the $2,092 swing high to the $1,905 low.
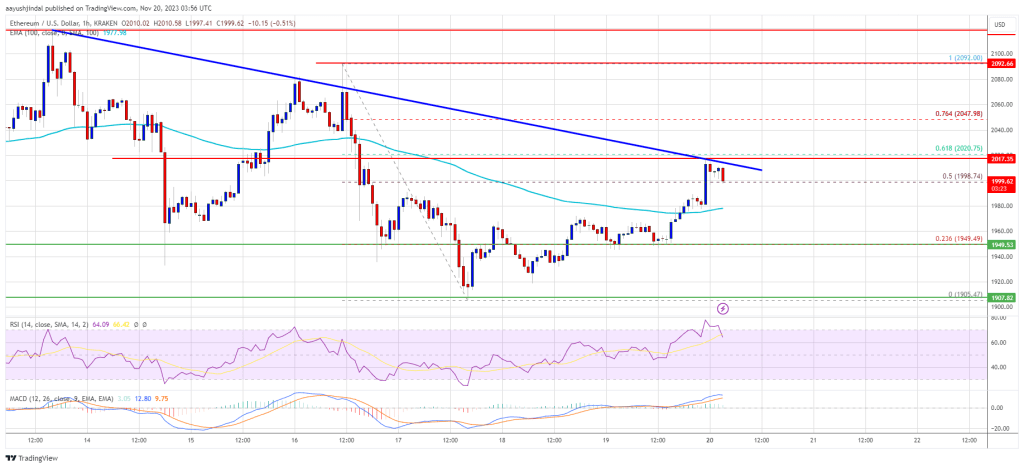
Source: ETHUSD on TradingView.com
A close above the $2,020 resistance could start another strong increase. The next resistance is near $2,090, above which the price could aim for a move toward the $2,120 level. Any more gains could start a wave toward the $2,200 level.
Another Drop in ETH?
If Ethereum fails to clear the $2,020 resistance, it could start a fresh decline. Initial support on the downside is near the $1,980 level and the 100-hourly Simple Moving Average.
The next key support is $1,950. The main support is $1,900. A downside break below the $1,900 support might trigger more losses. In the stated case, Ether could drop toward the $1,850 support zone in the near term. Any more losses might call for a drop toward the $1,800 level.
Technical Indicators
Hourly MACD – The MACD for ETH/USD is losing momentum in the bullish zone.
Hourly RSI – The RSI for ETH/USD is now above the 50 level.
Major Support Level – $1,950
Major Resistance Level – $2,020
- SEO Powered Content & PR Distribution. Get Amplified Today.
- PlatoData.Network Vertical Generative Ai. Empower Yourself. Access Here.
- PlatoAiStream. Web3 Intelligence. Knowledge Amplified. Access Here.
- PlatoESG. Carbon, CleanTech, Energy, Environment, Solar, Waste Management. Access Here.
- PlatoHealth. Biotech and Clinical Trials Intelligence. Access Here.
- Source: https://www.newsbtc.com/analysis/eth/ethereum-price-rally-in-jeopardy-2020/

