Ethereum failed again to settle above the $1,300 resistance against the US Dollar. ETH is moving lower and might soon test the $1,220 support zone.
- Ethereum attempted another upside break above $1,300, but failed.
- The price is now trading below $1,280 and the 100 hourly simple moving average.
- There was a break below a key bullish trend line with support near $1,272 on the hourly chart of ETH/USD (data feed via Kraken).
- The pair could correct further lower, but the $1,220 support is the key.
Ethereum Price Corrects Lower
Ethereum price made another attempt to surpass the $1,300 resistance zone. However, ETH struggled to gain momentum above the $1,300 level. A high was formed near $1,304 and the price started a downside correction, similar to bitcoin.
The price declined below the $1,280 support zone and the 100 hourly simple moving average. Besides, there was a break below a key bullish trend line with support near $1,272 on the hourly chart of ETH/USD.
Ether price traded as low as $1,248 and is currently consolidating losses. There was a minor increase above the $1,260 level. The price climbed above the 23.6% Fib retracement level of the recent decline from the $1,304 swing high to $1,248 low.
An immediate resistance on the upside is near the $1,270 level and the 100 hourly simple moving average. The first major resistance is near the $1,275 level. It is near the 50% Fib retracement level of the recent decline from the $1,304 swing high to $1,248 low.
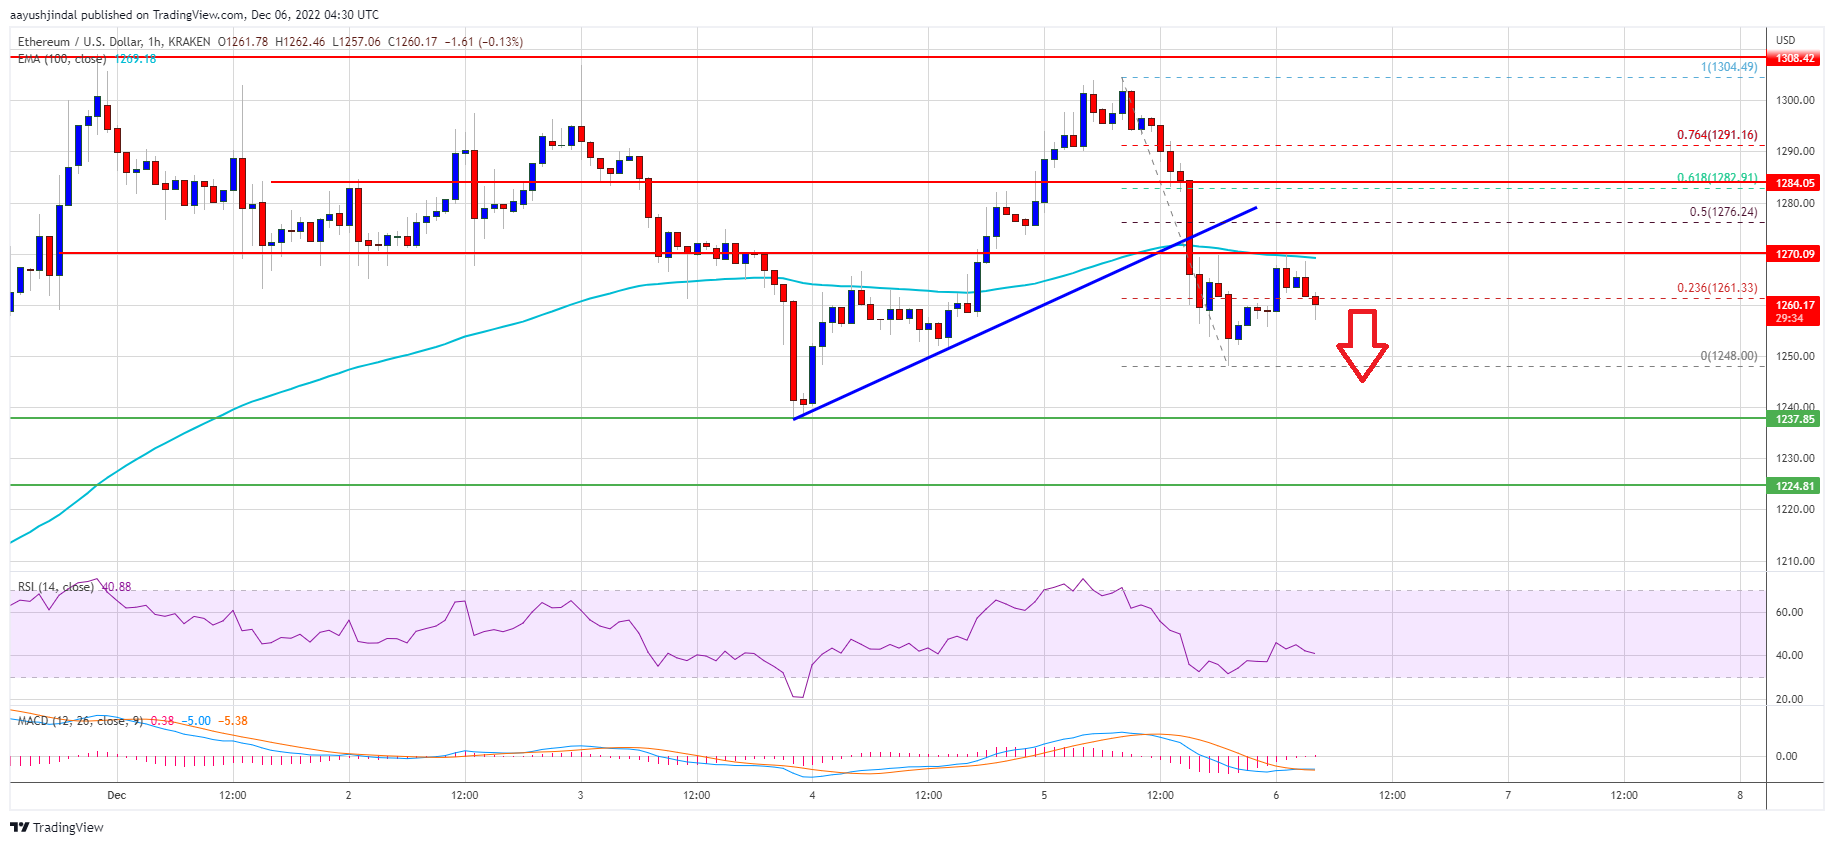
Source: ETHUSD on TradingView.com
A close above the $1,275 resistance might send the price further higher. The next major resistance is near the $1,300 level, above which ether price might test $1,320. Any more gains might send the price towards the $1,400 resistance zone.
Retest of a Key Support by ETH?
If ethereum fails to start another increase above the $1,275 resistance, it could continue to move down. An initial support on the downside is near the $1,250 level.
The next major support is near the $1,220 level. If there is a break below $1,220, the price could test the $1,165 support. Any more losses could lead the price towards the $1,100 support.
Technical Indicators
Hourly MACD – The MACD for ETH/USD is now gaining momentum in the bearish zone.
Hourly RSI – The RSI for ETH/USD is now below the 50 level.
Major Support Level – $1,220
Major Resistance Level – $1,275
Featured image from iStock
- SEO Powered Content & PR Distribution. Get Amplified Today.
- Platoblockchain. Web3 Metaverse Intelligence. Knowledge Amplified. Access Here.
- Source: https://newsbtc.com/analysis/eth/ethereum-price-correction-1220/

