<!–

–>
Published 57 mins ago
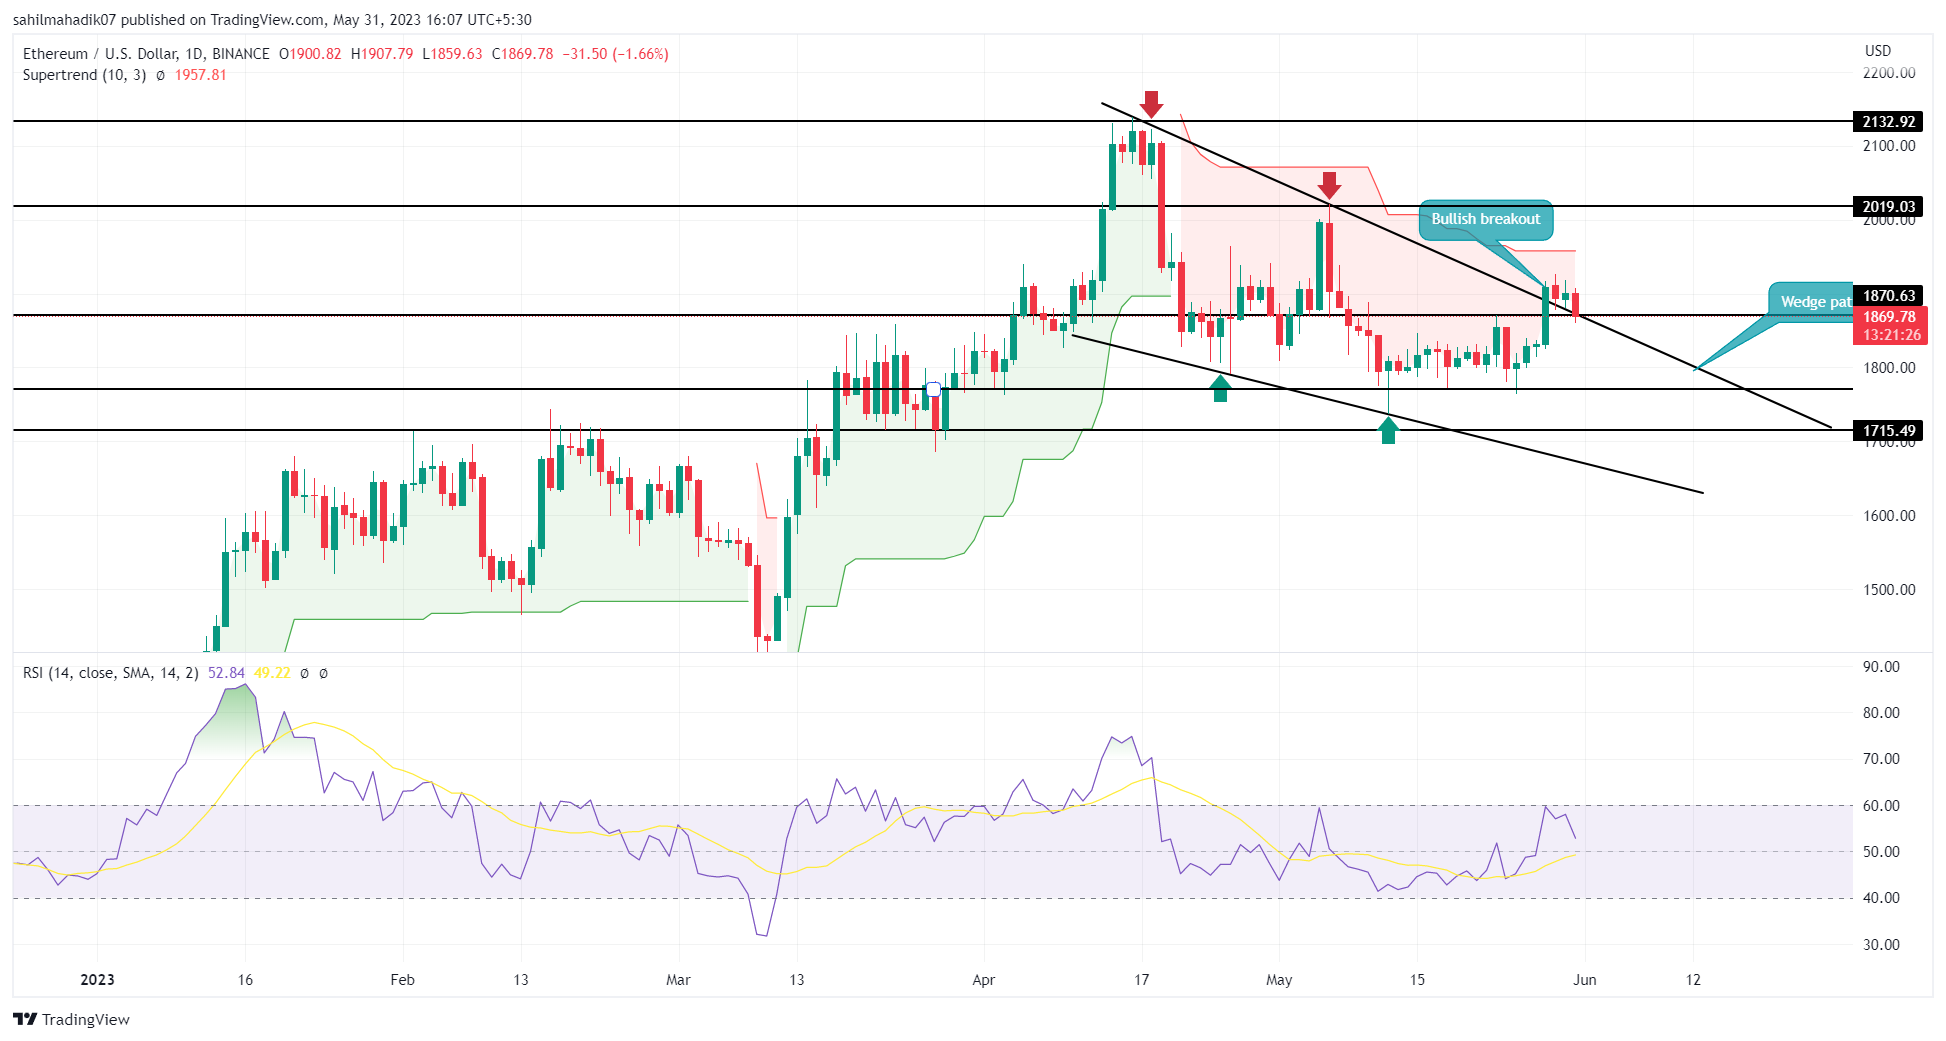
Ethereum Price Analysis: On May 28th, a significant uptick in the crypto market allowed the Ethereum price to clear the downsloping resistance trendline of the wedge pattern. This development was a sign of buyers’ attempt to retake trend control and lead a sustained recovery. However, the price is struggling to sustain above the breached trendline which could lead to a fake breakout scenario and a potential downfall.
advertisement
Also Read: Crypto Market Selloff: Here’s Why Bitcoin, Ethereum Price Falling Today
Ethereum Price Daily Chart
- The Ethereum price retests the recently reclaimed trendline to check whether prices can sustain higher levels or not.
- A breakdown below the downsloping trendline will hint at the resumption of the prior correction phase.
- The intraday trading volume in Ether is $6.2 Billion, indicating a 34% gain.
 Source- Tradingview
Currently, the Ethereum price trades at the $1871 mark with an intraday loss of 1.58%. The long red candle printed shows a breakdown attempt from the recently reclaimed trendline, indicating the sellers have not thrown the towel yet.
However, a candle closing below the combined support of $1870 and a downsloping trendline will create a bull trap scenario and intensify the selling pressure in the market. Any downfall below the trendline will continue to liquidate the aggressive buyers and their forced sell order could give another boost to downward momentum.
The post-breakdown fall could plunge the ETH price to 1770, followed by $1715-1700.
Conversely, if the coin price shows sustainability above the trendline by the day’s end, the uptrend potential for Ethereum mentioned in our previous article remains intact.
Will Ethereum Price Lose $1800 Mark Again?
A potential breakdown below the aforementioned trend will bring the market sellers back to the ETH price. The breached trendline will again act as a significant resistance to short sell and more likely plunge the price to the next crucial support zone of $1770.
- Relative Strength Index: The daily RSI slope reversal from the 60% mark reflects a lack of buyers’ strength to maintain a strong momentum rally.
- Supertrend: The red film projected in this indicator highlights the overall market trend remains bearish.
Share this article on:
advertisement
The presented content may include the personal opinion of the author and is subject to market condition. Do your market research before investing in cryptocurrencies. The author or the publication does not hold any responsibility for your personal financial loss.
<!– Close Story–>
- SEO Powered Content & PR Distribution. Get Amplified Today.
- PlatoAiStream. Web3 Data Intelligence. Knowledge Amplified. Access Here.
- Minting the Future w Adryenn Ashley. Access Here.
- Buy and Sell Shares in PRE-IPO Companies with PREIPO®. Access Here.
- Source: https://coingape.com/markets/ethereum-price-analysis-bull-trap-puts-eth-price-risk-of-correction-sell-or-hold/

