SNEAK PEEK
- Ethereum hits 6-month price high, signaling investor confidence.
- Bulls take control, driving ETH to intraday high despite bearish attempts.
- Strong momentum and positive indicators suggest potential for ETH price rise.
According to data from Glassnode, the real-world price of Ethereum (ETH) just hit a 6-month high of $1,467.51. This achievement shows that the average price at which Ethereum tokens were most recently transferred on-chain has reached its highest point. This could indicate that users and investors are willing to hold onto their tokens for longer periods of time, which could be good news for the Ethereum network’s overall health and growth.
📈 #Ethereum $ETH Realized Price just reached a 6-month high of $1,467.51
View metric:https://t.co/9xWb0WuEGn pic.twitter.com/VCDAFS8XVG
— glassnode alerts (@glassnodealerts) June 3, 2023
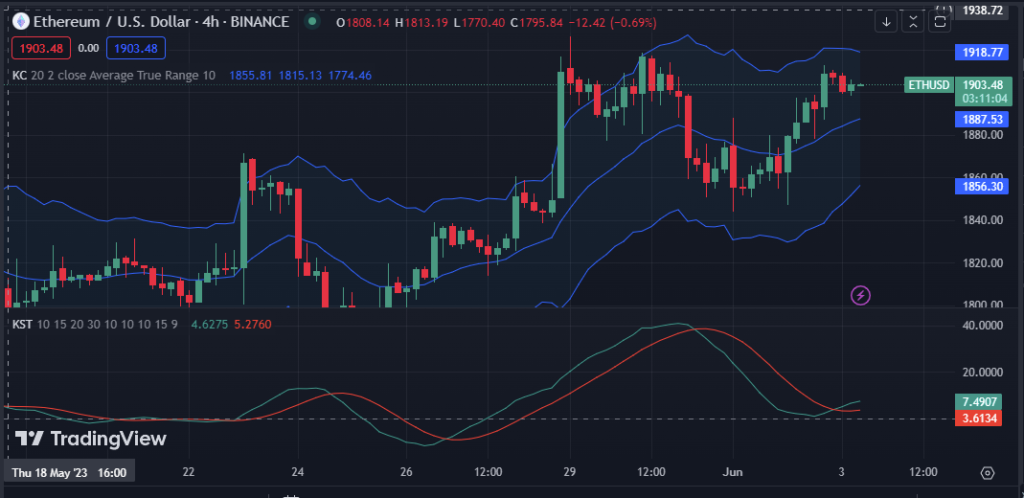
However, despite bears’ attempts to dominate the ETH market at an intraday low of $1878.61, bulls gained strength and took control of the market, driving prices to an intraday high of $1910.28, in the past 24 hours. Due to the ongoing bullish trend, the price of ETH had increased by 0.76% to $1903.70 at the time of writing.
ETH’s market capitalization increased by 0.75% to $228,894,523,702, while the 24-hour trading volume decreased by 10.73% to $4,982,425,203. This action suggests that investors remain confident in the market’s long-term potential even though there may be less trading activity for ETH in the near future.
On the ETH 4-hour price chart, the Keltner Channel bands are pointing north and have upper and lower readings of 1918.80 and 1856.33, respectively, indicating a bullish trend. With a sell target price close to the upper Keltner Channel, traders may want to buy ETH at the current levels.
The bullish momentum is supported as green candlesticks begin to form on the price chart for ETH and price action moves higher than the middle band. However, traders should be aware of potential resistance levels and use a stop loss to minimize risk in the event that the bulls’ strength wanes.
The Know Sure Thing (KST), with a reading of 7.5054 and moving above its signal line, shows that bullish momentum is increasing in the market. Investors may view a KST line crossing below the signal line as a sell signal and consider liquidating existing long positions or establishing new ones.
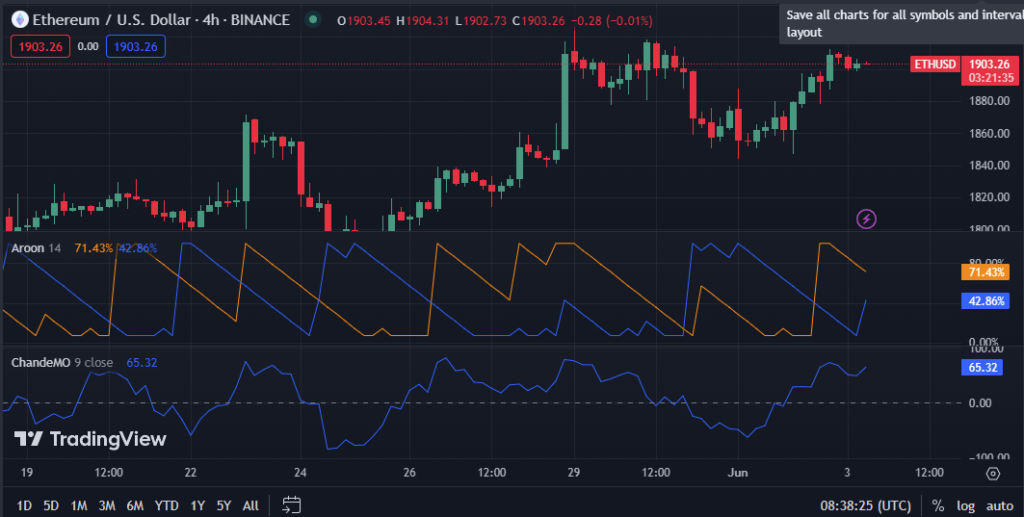
On the 4-hour price chart, the Aroon up and down values are 71.43% and 42.86%, respectively. Despite the possibility of minor reversals or corrections along the way, this movement shows that the trend is strong and is more likely to last for a while, enabling traders to identify potential entry and exit opportunities for trades.
The Chande Momentum Oscillator (ChandeMo) has a line pointing north and a positive value of 65.32 on the 4-hour price chart of the ETH market. This movement is an indication that buyers are in charge and that prices may rise soon as it reflects the market’s strong momentum and positive tendency.
In conclusion, Ethereum’s price surge to a 6-month high suggests bullish sentiment and investor confidence, indicating a potential for sustained growth and market strength.
Disclaimer: Cryptocurrency price is highly speculative and volatile and should not be considered financial advice. Past and current performance is not indicative of future results. Always research and consult with a financial advisor before making investment decisions
- SEO Powered Content & PR Distribution. Get Amplified Today.
- PlatoAiStream. Web3 Data Intelligence. Knowledge Amplified. Access Here.
- Minting the Future w Adryenn Ashley. Access Here.
- Buy and Sell Shares in PRE-IPO Companies with PREIPO®. Access Here.
- Source: https://investorbites.com/ethereum-eth-price-analysis-03-06/

