Chainlink Price has been attempting to reverse its recent losses over the past few weeks. Currently, Chainlink is trading under a crucial resistance mark which has caused the altcoin to face rejection.
Over the last 24 hours, Chainlink has managed to appreciate by only 0.4%, signifying that it has been consolidating. On the weekly chart, LINK has already increased by 1.8%. Continued price consolidation will cause the bears to take over the price completely.
The technical outlook of the altcoin has also sided with the bears as buying strength showed signs of struggle. Both demand and accumulation have therefore remained low on the chart. As Bitcoin trades inside the $ 27,000 price zone, major altcoins have also been trying to move north on their respective charts.
If Bitcoin does not stabilize above the $ 27,500 price, sellers can exert another pull on Chainlink, causing the price to fall further. The market capitalization of Chainlink declined, which indicated that buying strength remained low at press time.
Chainlink Price Analysis: One-Day Chart
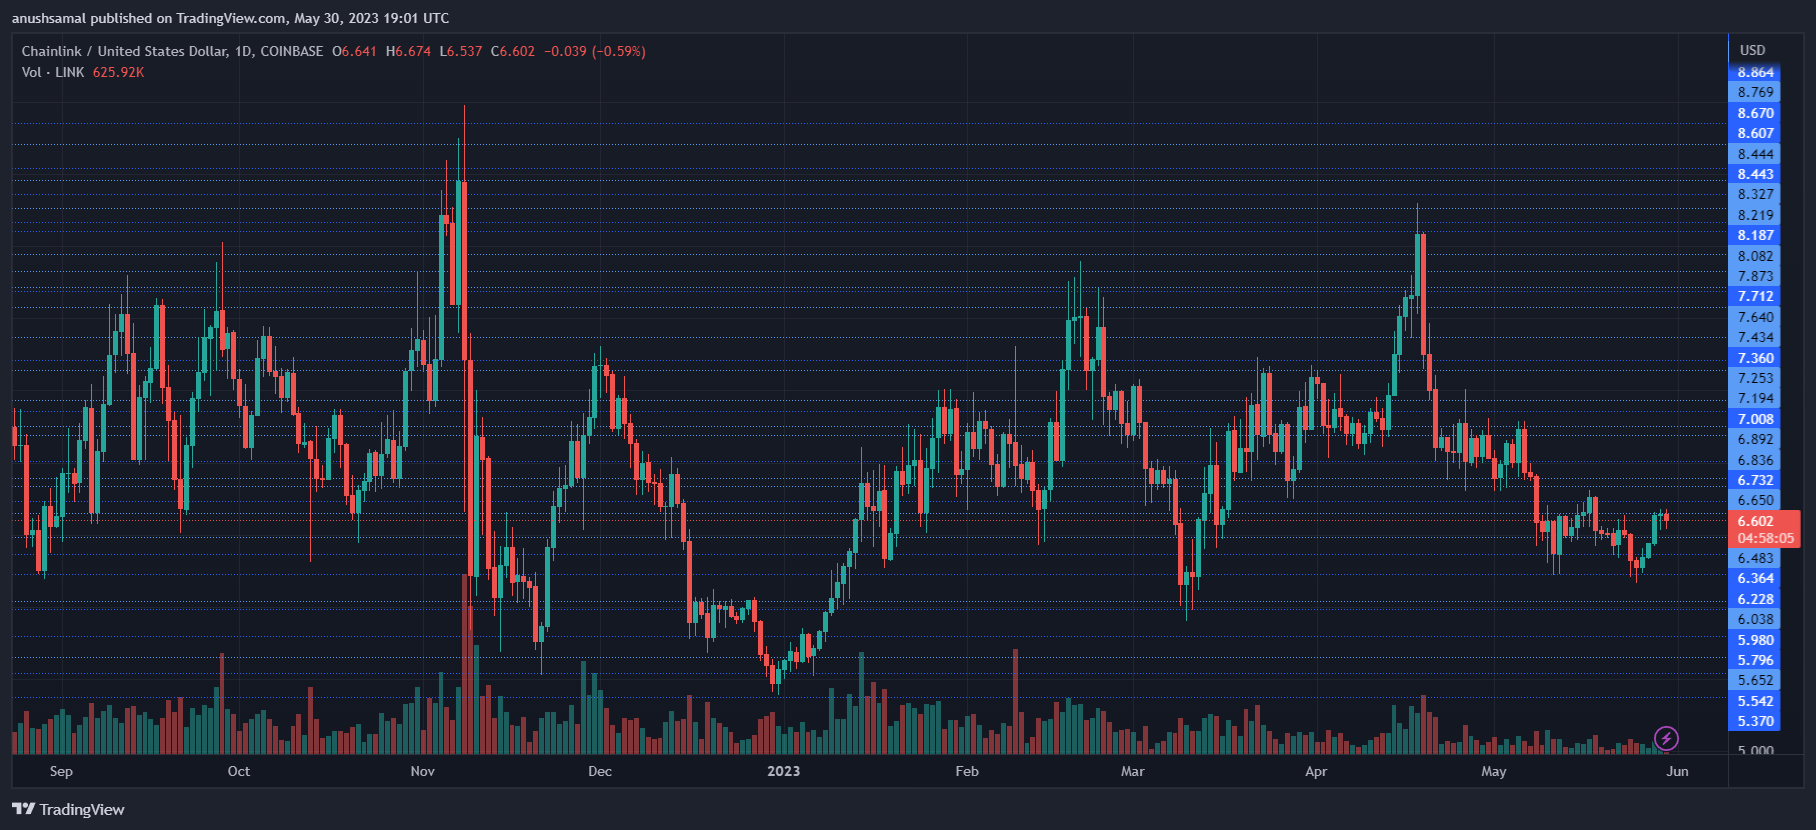
When writing, Chainlink (LINK) was trading at $6.60. However, this price level has proven to resist the altcoin strongly. Despite this, the bulls have managed to prevent further price retracement. The overhead resistance for LINK is currently set at $6.80.
LINK has been trading between $6.20 and $6.80 in recent weeks. Breaking above the upper boundary of this trading range is crucial for LINK bulls.
Failing to breach the $6.80 resistance level would likely result in the dominance of the bears. If the price declines, the initial support level is $6.20.
Further downside movement could see LINK trading near the $6.00 price level. The trading volume of Chainlink in the last session was low, indicating a limited number of buyers in the market.
Technical Analysis For LINK
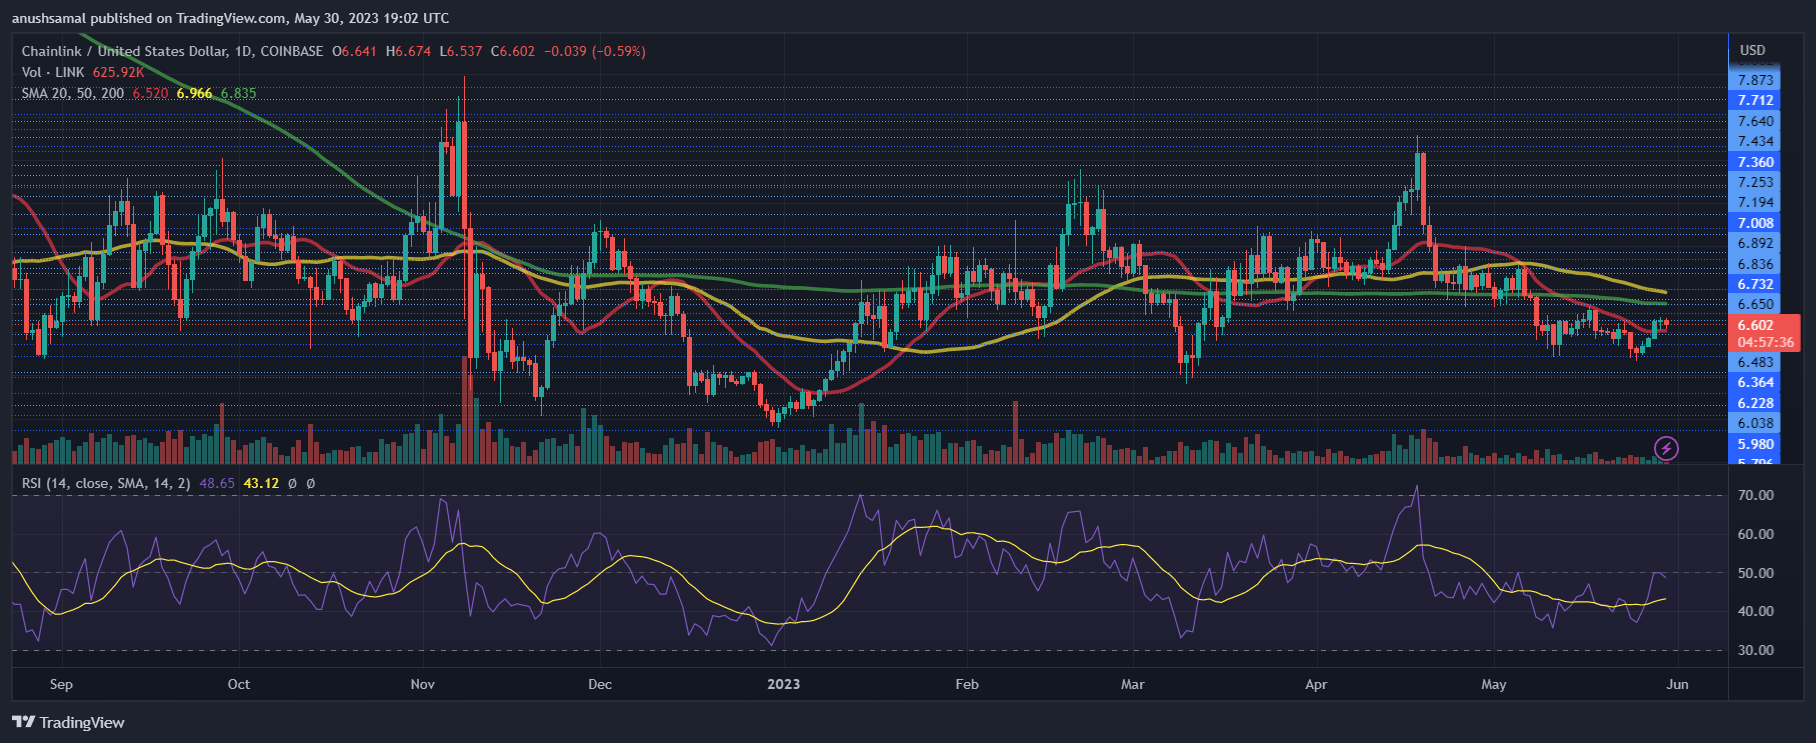
Chainlink (LINK) faced difficulties attracting buyers during May and most of April. The Relative Strength Index (RSI) has consistently remained below the 50-level, suggesting buyers have lost interest in LINK due to recent price rejections.
Additionally, LINK has fallen below the 20-Simple Moving Average (SMA) line, indicating that sellers have been driving the price momentum in the market.
To regain bullish momentum, it is crucial for LINK to move above the $6.60 level, which would enable the altcoin to trade above the 20-SMA line.
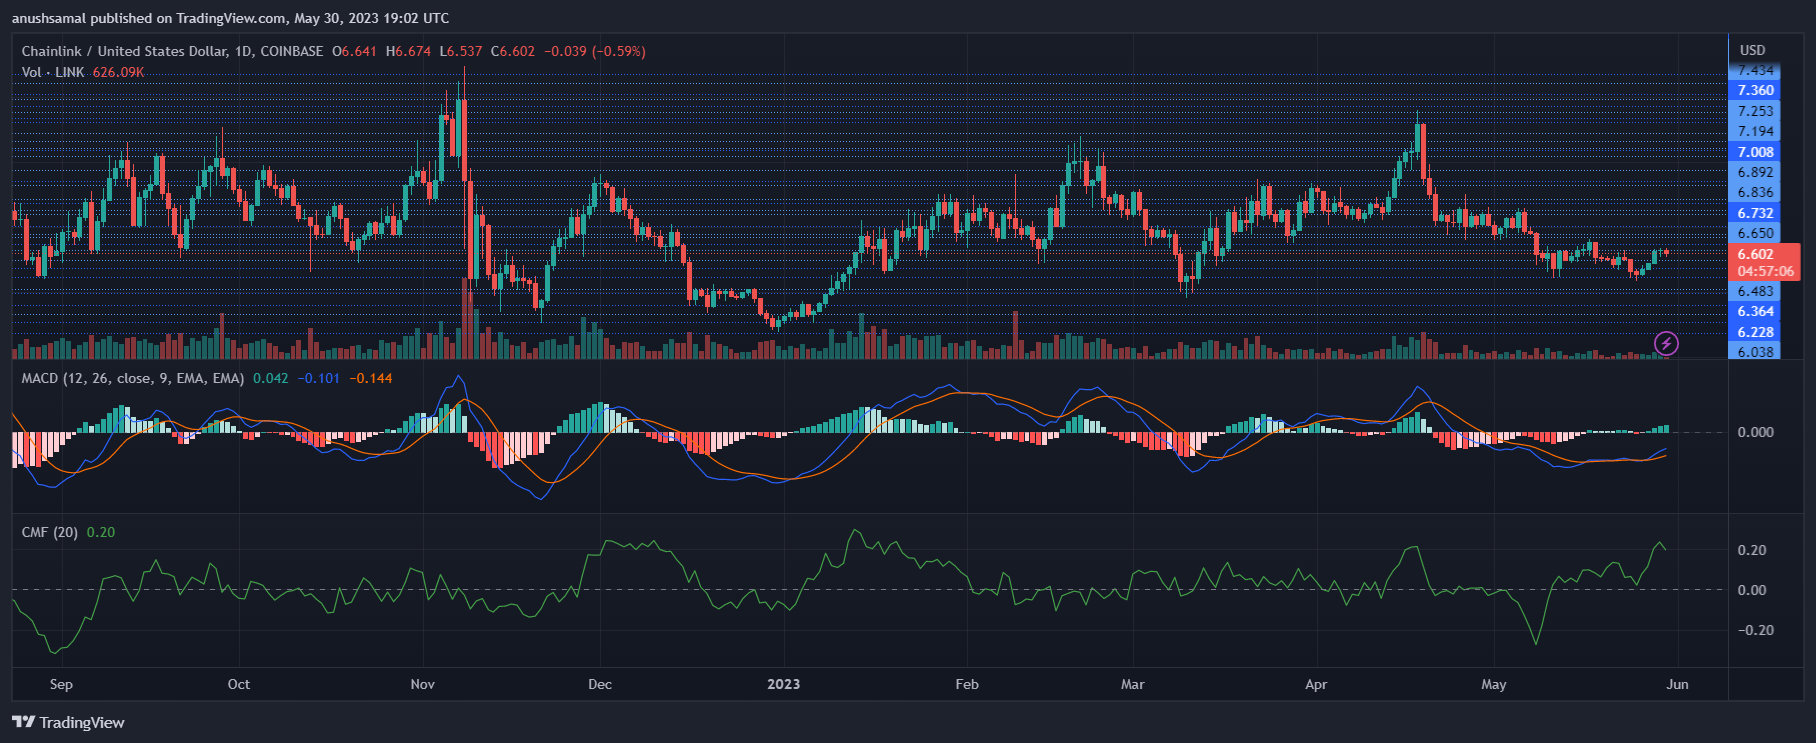
In contrast to other technical indicators, Chainlink (LINK) exhibited the emergence of a buy signal on the daily chart. The Moving Average Convergence Divergence (MACD) showed the formation of green histograms, suggesting the potential for bullish momentum to develop.
Additionally, the Chaikin Money Flow (CMF), which measures capital inflows, displayed a positive reading as it crossed above the half-line. These indicators indicate a possible shift in market sentiment, with increased buying interest and inflows into LINK.
Featured Image From SoFi, Charts From TradingView.com
- SEO Powered Content & PR Distribution. Get Amplified Today.
- PlatoAiStream. Web3 Data Intelligence. Knowledge Amplified. Access Here.
- Minting the Future w Adryenn Ashley. Access Here.
- Buy and Sell Shares in PRE-IPO Companies with PREIPO®. Access Here.
- Source: https://www.newsbtc.com/news/chainlink/chainlink-bulls-must-overcome-key-hurdle-for-potential-7-rally/

