🪟 View all charts covered in this report in the Buying High and Selling Low: The Long-Term Holder Learning Curve Dashboard.
Introduction
Like the weather, markets tend to experience cycles, and nowhere is this more true than for Bitcoin. One of the characteristics of Bitcoin market cycles is that they reach extreme-extremes, often defined by irrational exuberance at tops, and deep despair at the lows. Within the wealth of on-chain data available to us, we can study these periods, and identify when investor behaviors aligns with market extremes.
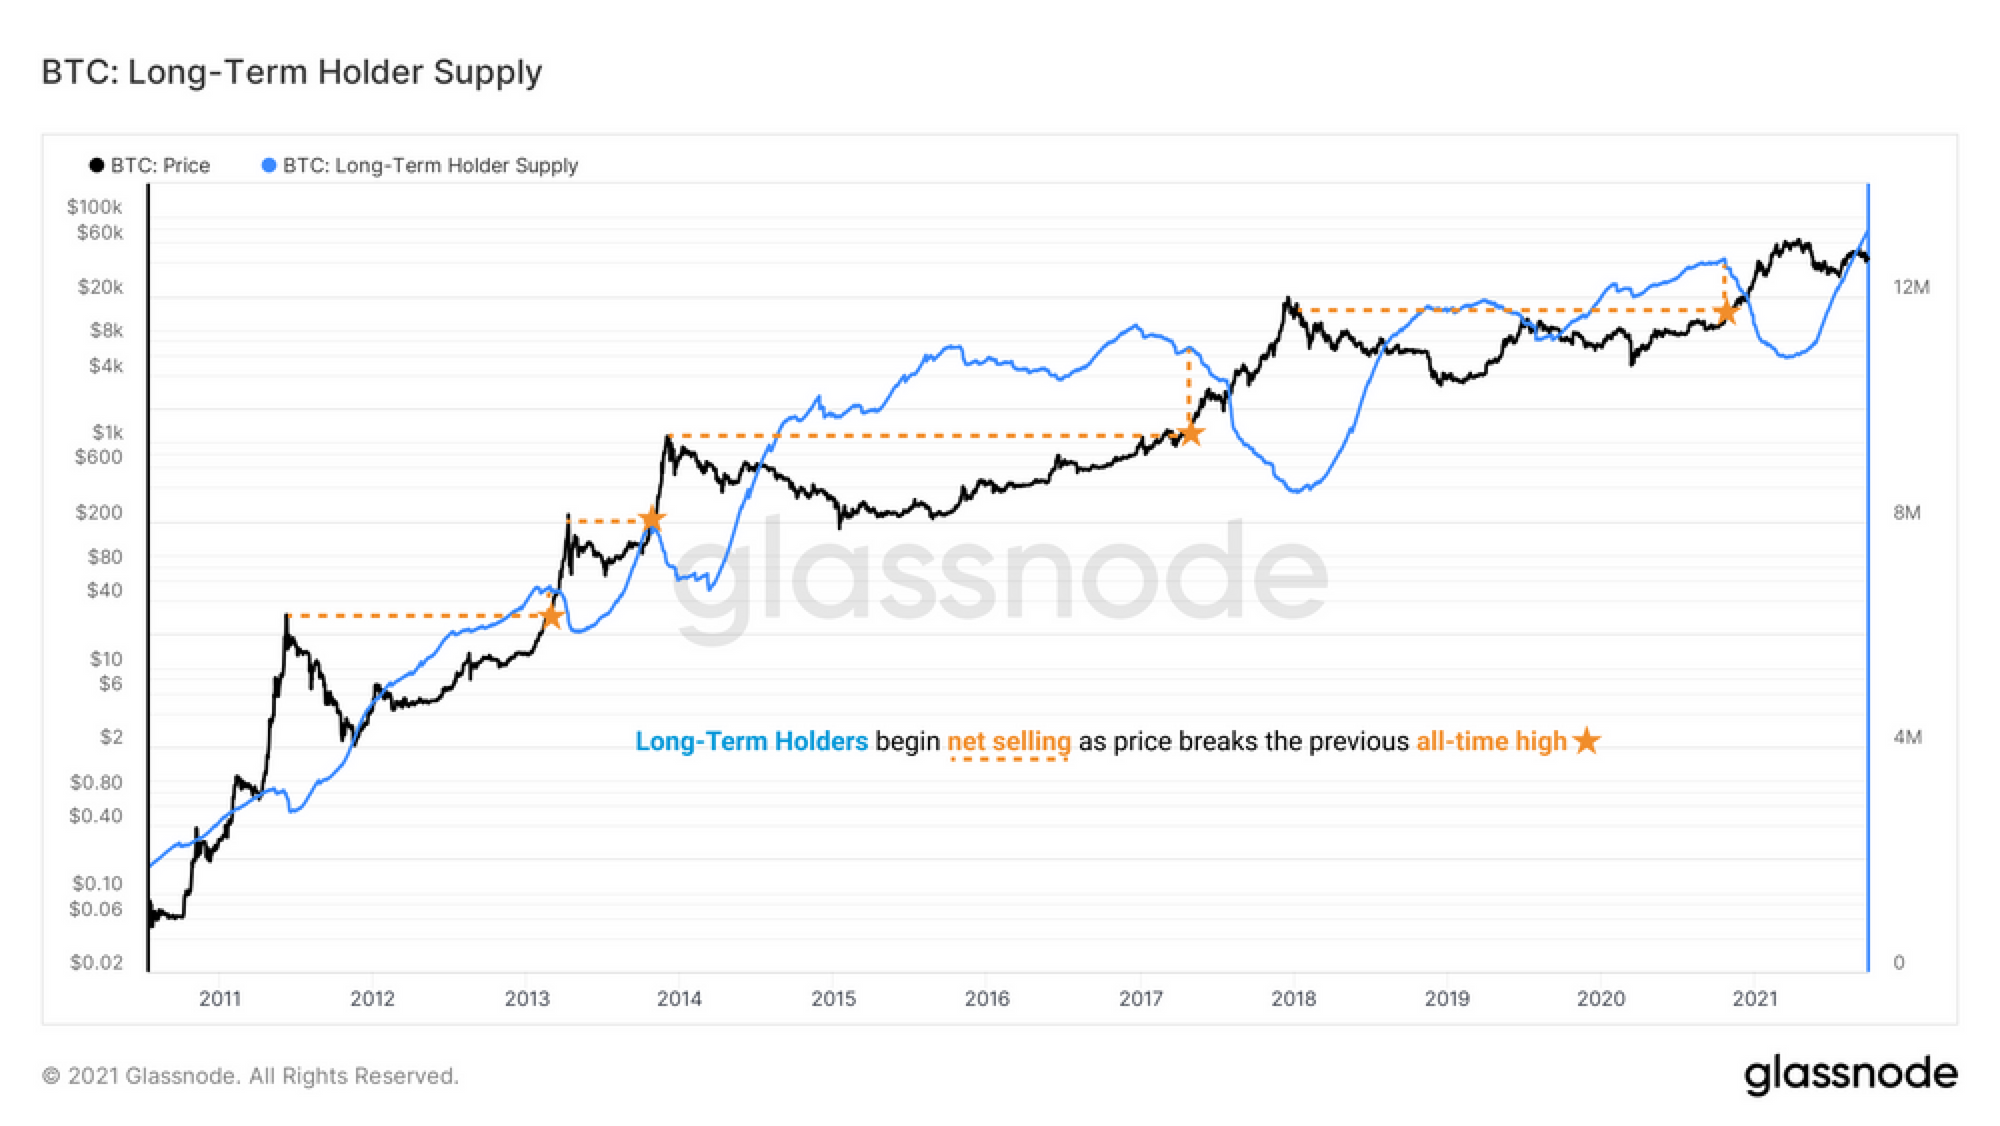
In a previous study, we defined the Long-term Holder (LTH) heuristic, which segments the coin supply into holders that are least likely to spend on any given day. We expanded on this research in Following the Smart Money, where we demonstrated how LTHs generally accumulate BTC at cheap prices in bear markets, and then distribute heavily, particularly in late stage bulls.
In other words, LTHs tend to buy low and sell high, thus earning them the generalized title of ‘the smart money’.
However, anyone with experience in markets knows that few investors start their journey as the ‘smart money’. Instead it is learned through experience, which more often than not comes as a result of being wrong, losing money, and making the exact wrong trade decision at the exact wrong time.
In this piece, we will explore the behavior of a very particular subset of LTHs; those experiencing their first Bitcoin market cycle. What we will demonstrate is that this cohort of budding HODLers tend to acquire and hold onto expensive coins through the entire bear market…only to capitulate precisely at the cycle low, with remarkable accuracy.
Surviving Your First Bear Market
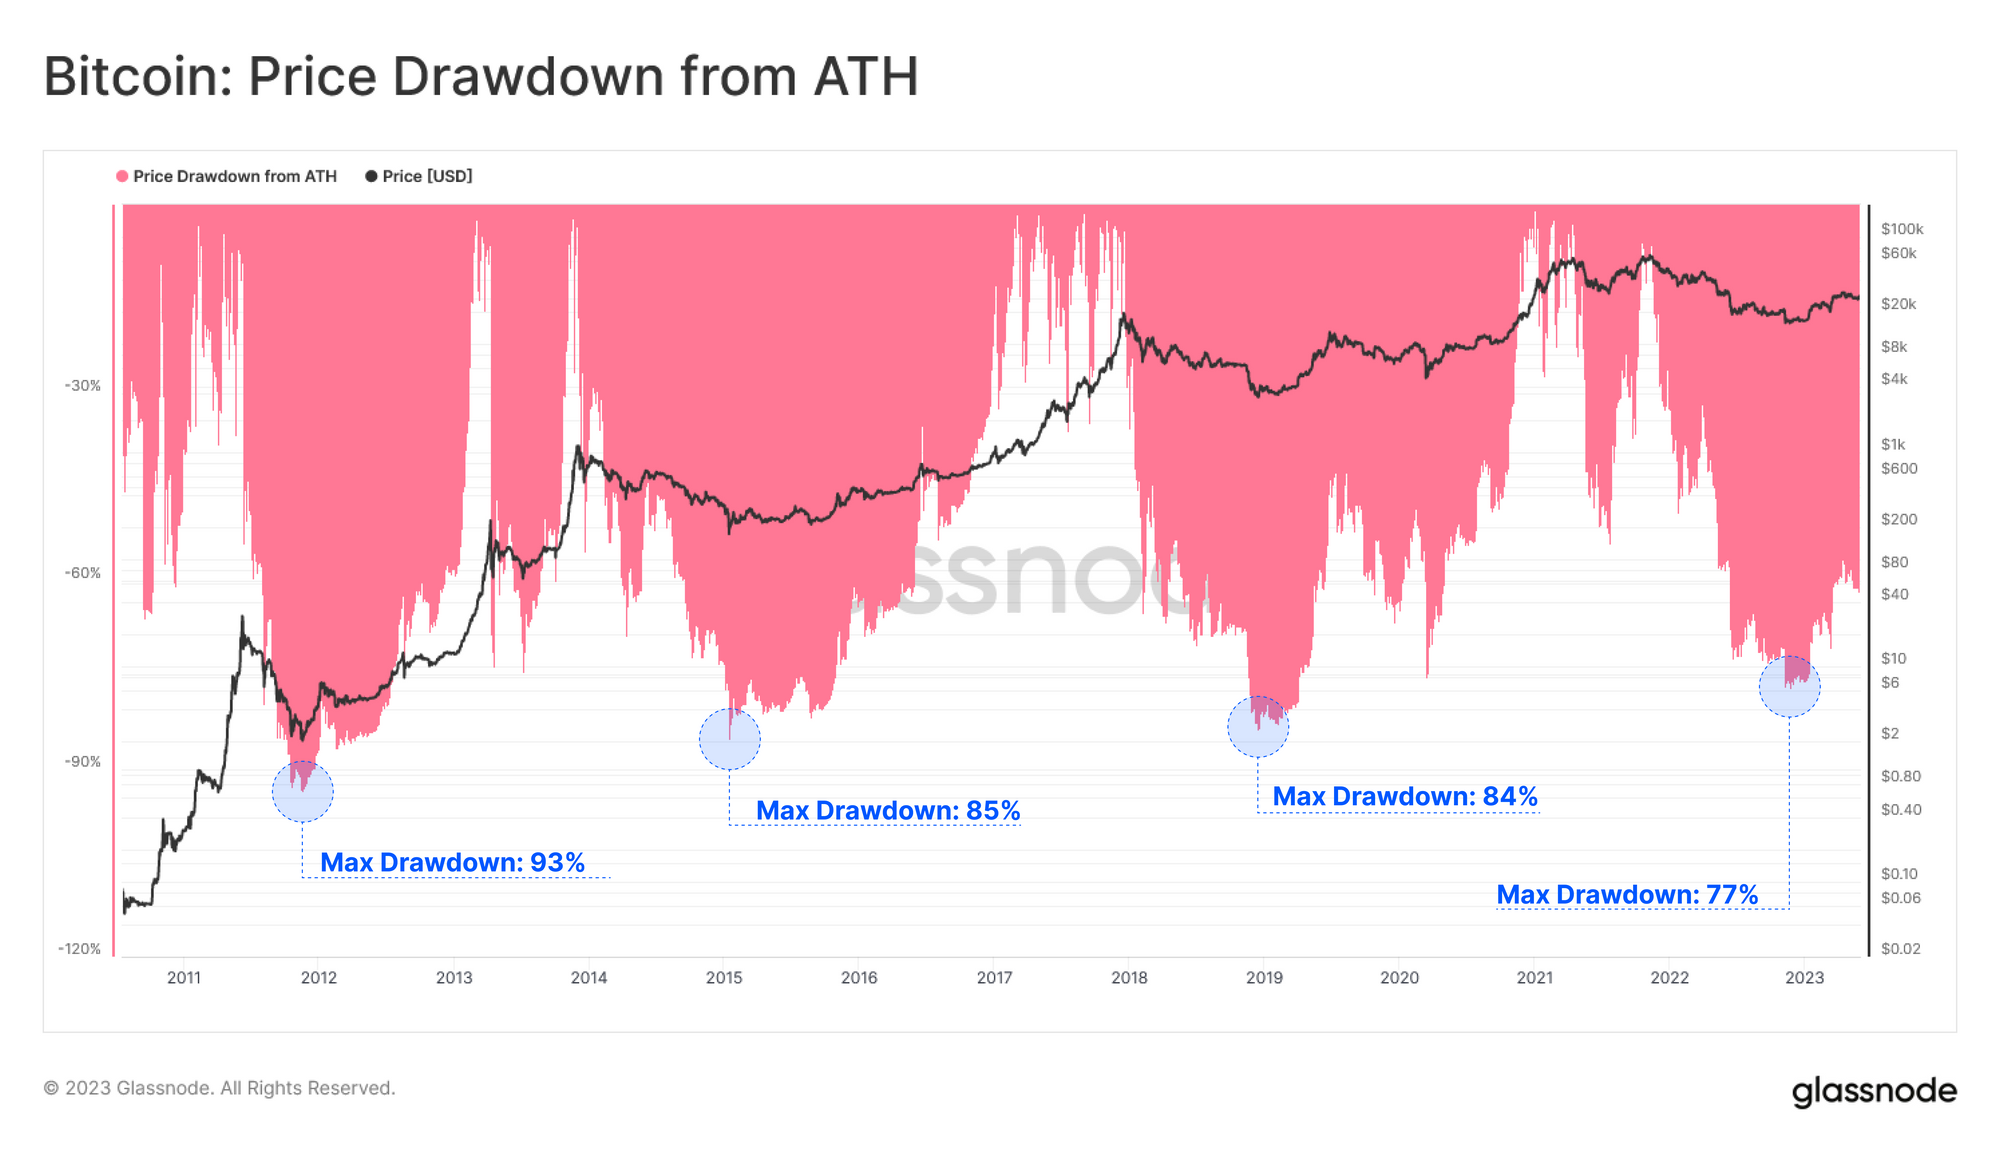
The first Bitcoin bear market investors experience is usually the hardest. Few investors are prepared for the extreme volatility, nor the 75%+ drawdowns that BTC prices historically reach.
We can see this by the incredible total volume of coins which transact at a loss during bear markets. The chart below shows the cumulative volume of BTC moved at a price lower than its acquisition price during each bear market cycle to date (with horizontal levels at 21M BTC increments for scale).
By the time FTX collapsed in Nov 2022, over 123M BTC had transacted at a loss since the April 2021 peak (where we believe bear market sentiment had truly set in).

The Long-Term Holder heuristic uses a 155-day threshold, which is around 5-months. Historical Bitcoin bear markets have spanned between 500 to 800 days from top to bottom (around 2-years).
Thus, we can define a coin age range between 5-months and 2-years which we will consider as representative of these single cycle LTHs.
Buying High
We have several tools at our disposal to identify periods of LTH stress, which we will break into two sub-categories:
- Unrealized Stress: being the paper losses held by the LTH cohort, which can be though of as the incentive to sell. This can be monitored using LTH-MVRV, LTH-NUPL, and Supply in held Loss for example.
- Realized Stress: being the actualized losses taken by coins spent by the LTH cohort, reflecting true capitulation events. This can be monitored using LTH-SOPR, Realized Loss, and Spent Volume in Loss.
All of these tools revolve around the Realized Price, representing the on-chain acquisition price for the cohort considered.
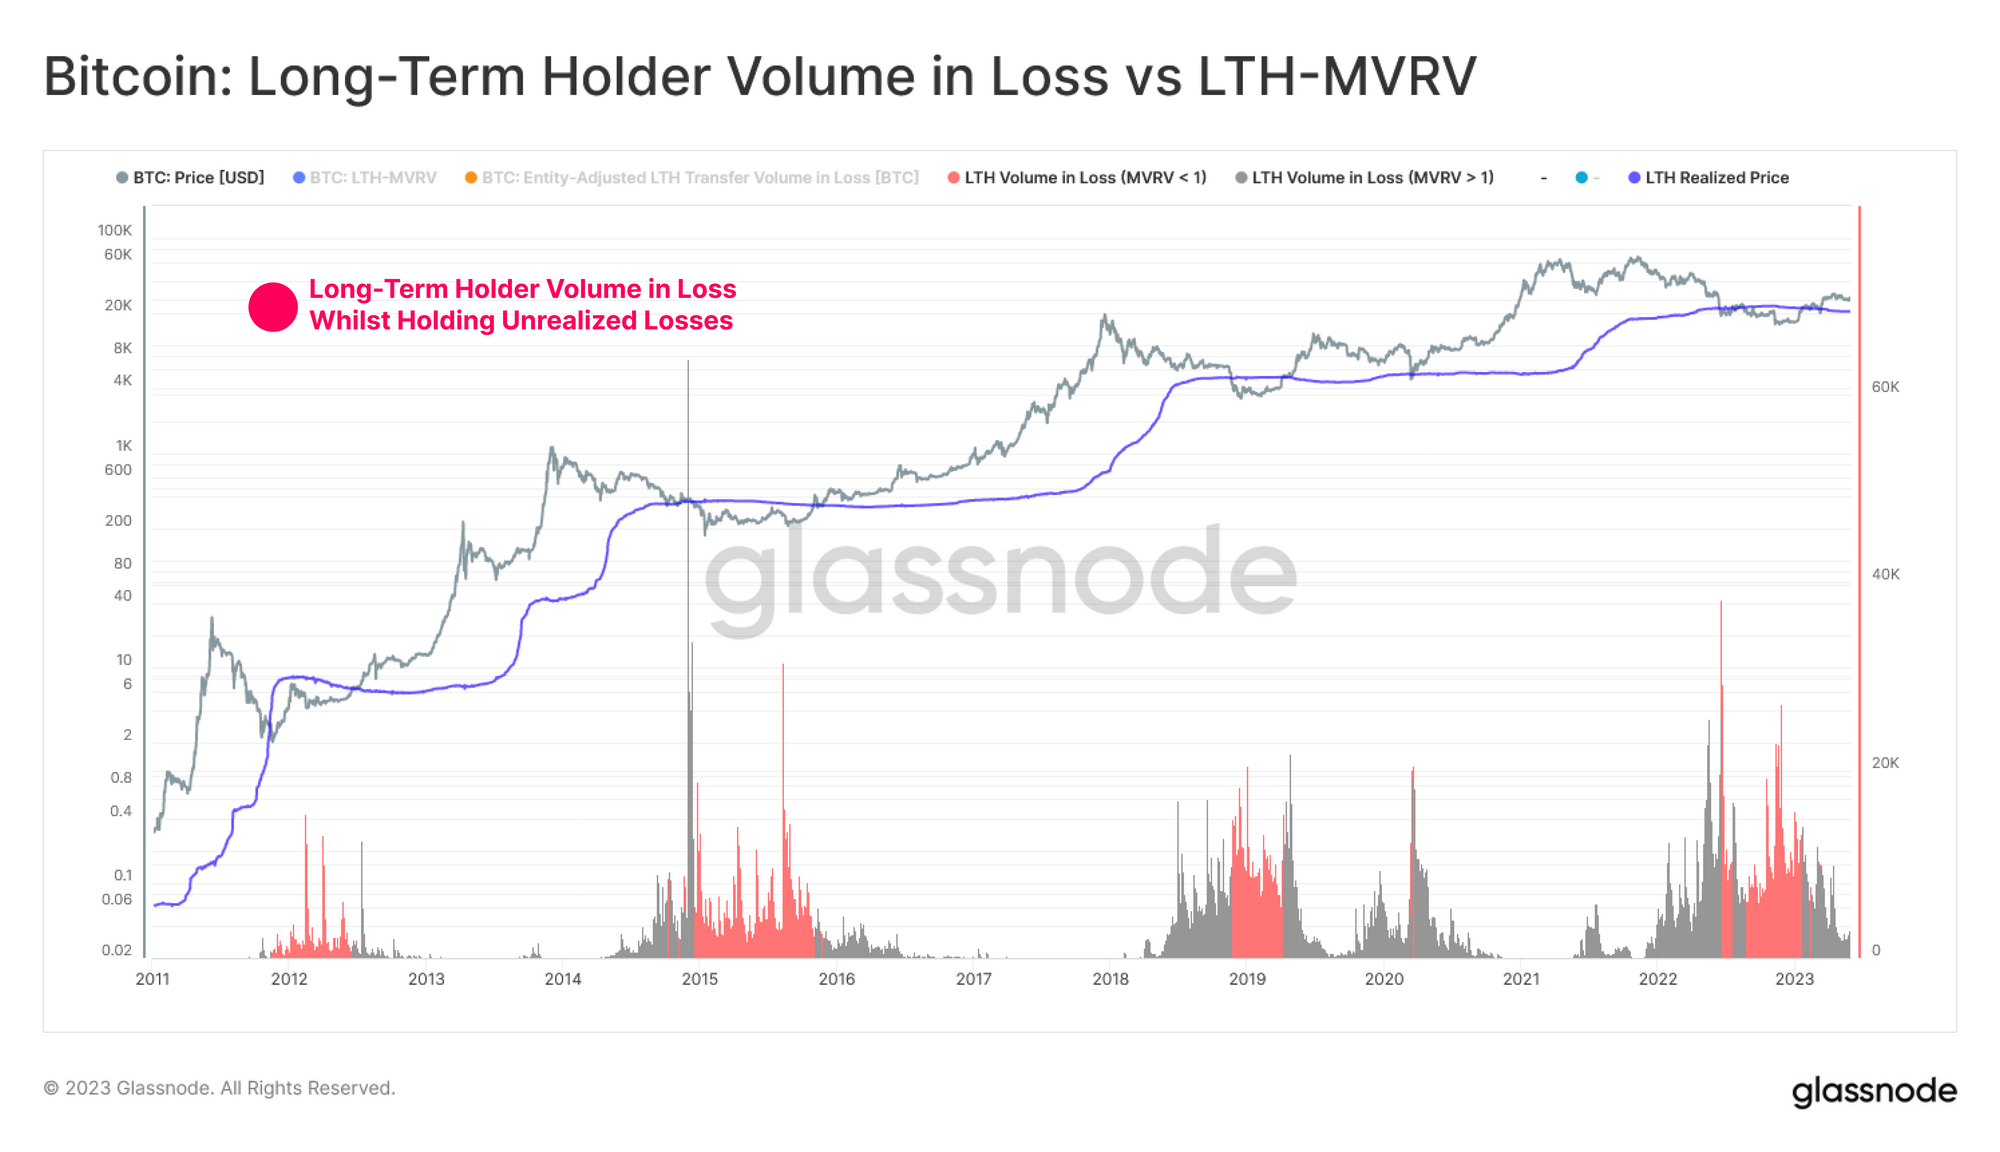
In aggregate, we can compare the deviation between spot price and the LTH average acquisition price via the LTH-MVRV metric. This provides insight into the magnitude unrealized profit or loss they collectively hold. From this we develop a simple tool to check whether LTHs are under unrealized stress:
🔴 When LTH-MVRV trades below 1.0, it indicates that this cohort are holding large scale unrealized losses. These investors are under a significant degree of unrealized stress, and are therefore increasingly likely to capitulate their held supply.

The chart below shows the total spent volume in loss attributed to LTHs. Periods where the above unrealized stress condition is hit (LTH-MVRV < 1.0) are marked in red. Whilst individual investors can, and do capitulate throughout the entire bear market, it is immediately clear that this flush-out reaches a crescendo right at the bitter end.
Selling Low
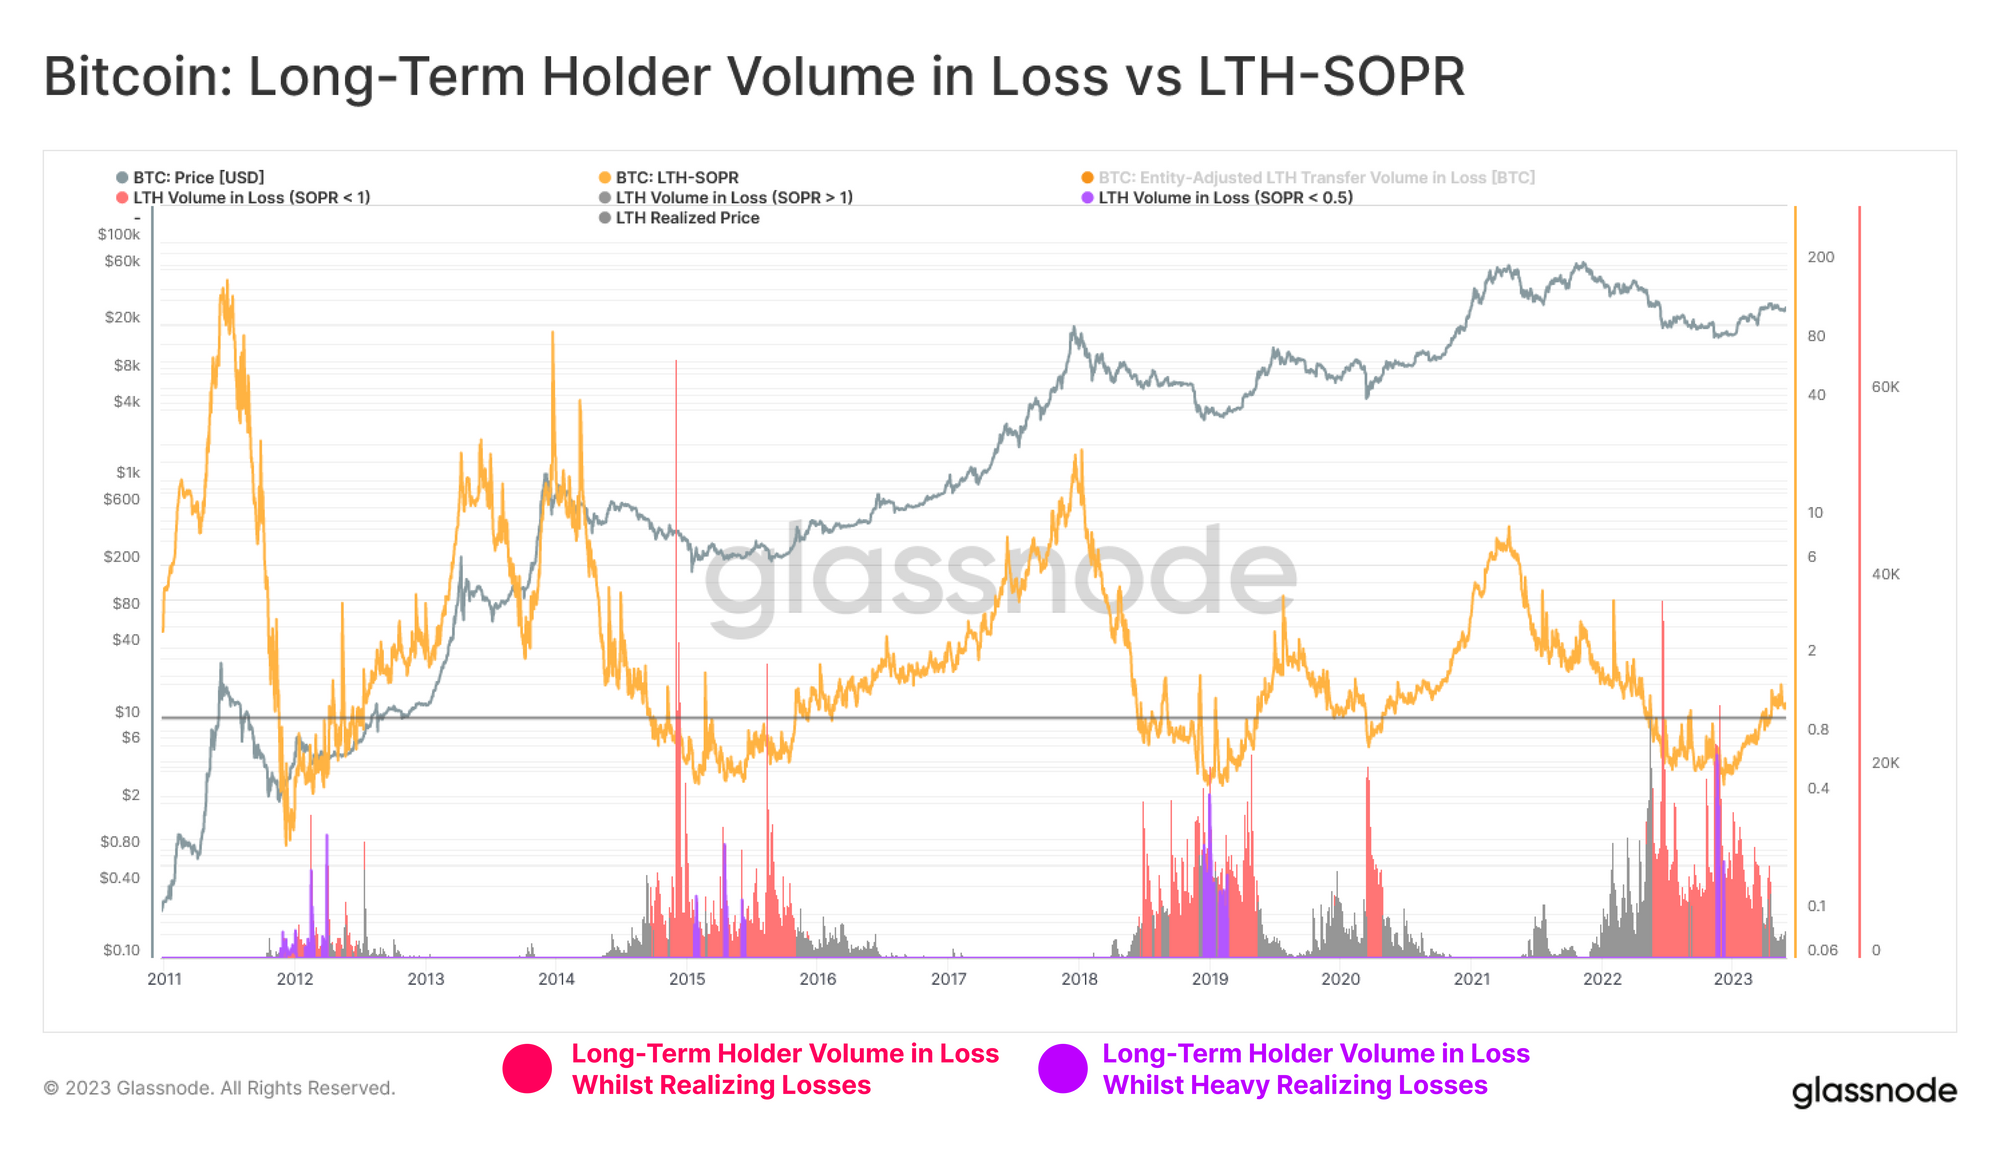
Now that we have a measure for LTH unrealized stress, we can supplement it with an equivalent measure of realized stress. For this, the LTH-SOPR metric is ideal, capturing the the aggregate profit / loss multiple locked by the Long-Term Holder class each day.
The chart below shows a similar profile of LTH Volume In Loss, however we highlight two key conditions:
- 🔴 When LTH-SOPR trades below 1.0, it indicates that this cohort are locking in realized losses on average, where the majority are spending coins below their acquisition price.
- 🟣 When LTH-SOPR trades below 0.5, it indicates that the average LTH is locking in 50%+ losses, exiting as their investment is cut in half.
This second condition is most interesting, since it represents a cohort of investors that have both held coins to LTH maturity, but also held from a price altitude that is close to the cycle top (within the context of a 75% drawdown).
Given the duration of a Bitcoin bear (~2ys), and typical 75% drawdown, these LTHs in particular have actually weathered the worst of it by the time they exit.
Capitulation, All At Once
In the prior section, we identified the periods of peak financial stress for LTHs. Next we will isolate periods where these single cycle LTHs (6m-2y) are the predominant source of transfer volume in loss.
The chart below displays the percentage of LTH Transfer Volume which is sourced from the 6m-2y age-band. In particular, we can compare it to its lifetime average, and +0.5 sigma standard deviation band. From this, we can identify two particular characteristics:
- 🔴 Periods where single cycle LTHs (6m-2yr) are most active tends to be during later stages of bear markets (exiting in capitulation), as well as during early bull markets (exiting in disbelief). This group are observably buying high, and selling low.
- 🔵 Periods where multi-cycle LTHs (> 2yrs) are most active tends to be during the most opportune periods of bull markets, observably buying low, and selling high.
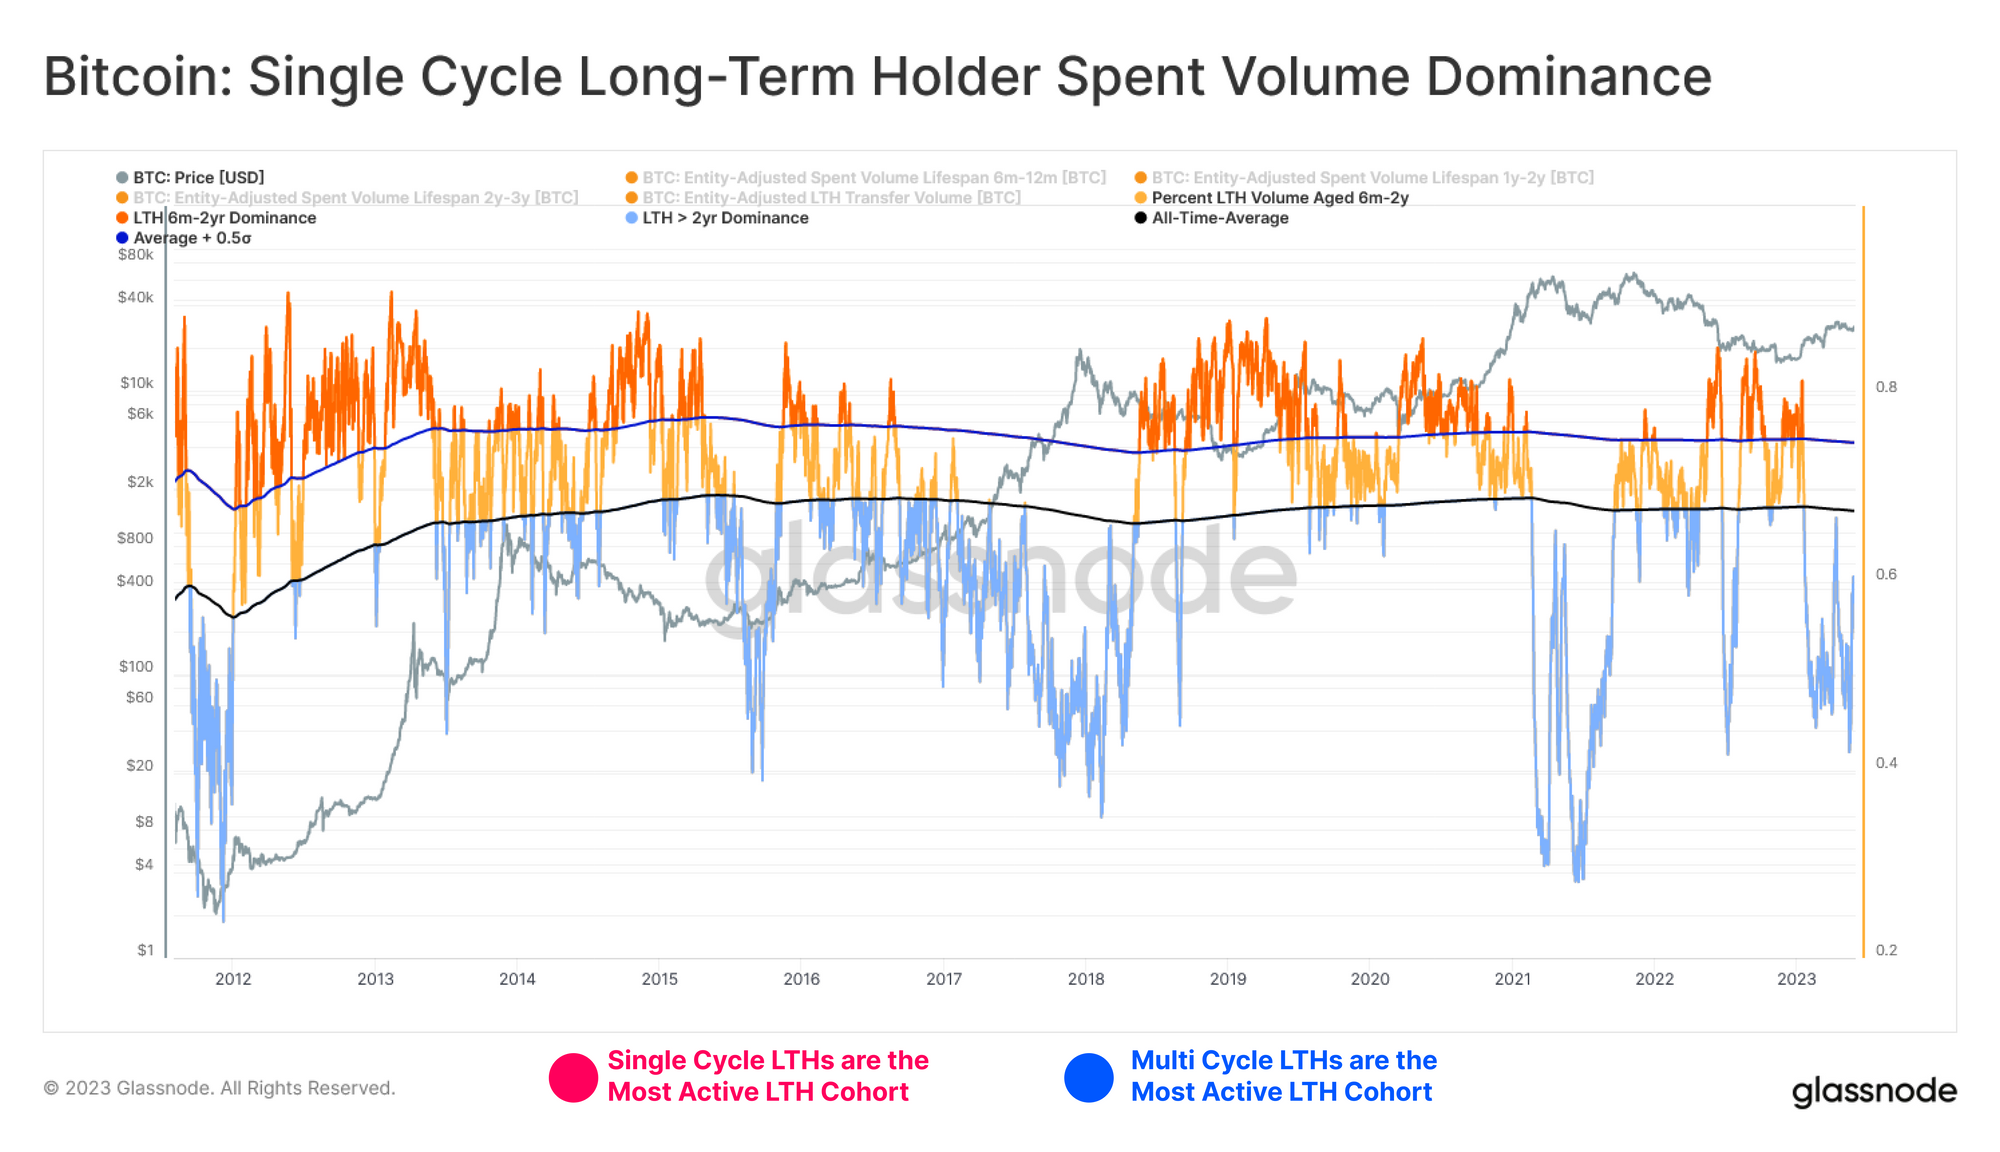
Thus, we have our final conditionality statement; when the percent of LTH spending attributed to single cycle holders exceeds 0.5 standard deviations above the mean, it often signifies capitulation of this group has taken place.
Long-Term Learning Curve
We set out to observe and characterize the painful learning curve of Bitcoin Long-Term Holders who are experiencing their first bear market cycle. What we identified is that the probability of a bear market floor being established, tends to align with their expulsion from the market.
Those who rode significant unrealized losses from the cycle peak, often capitulate at the ultimate lows.
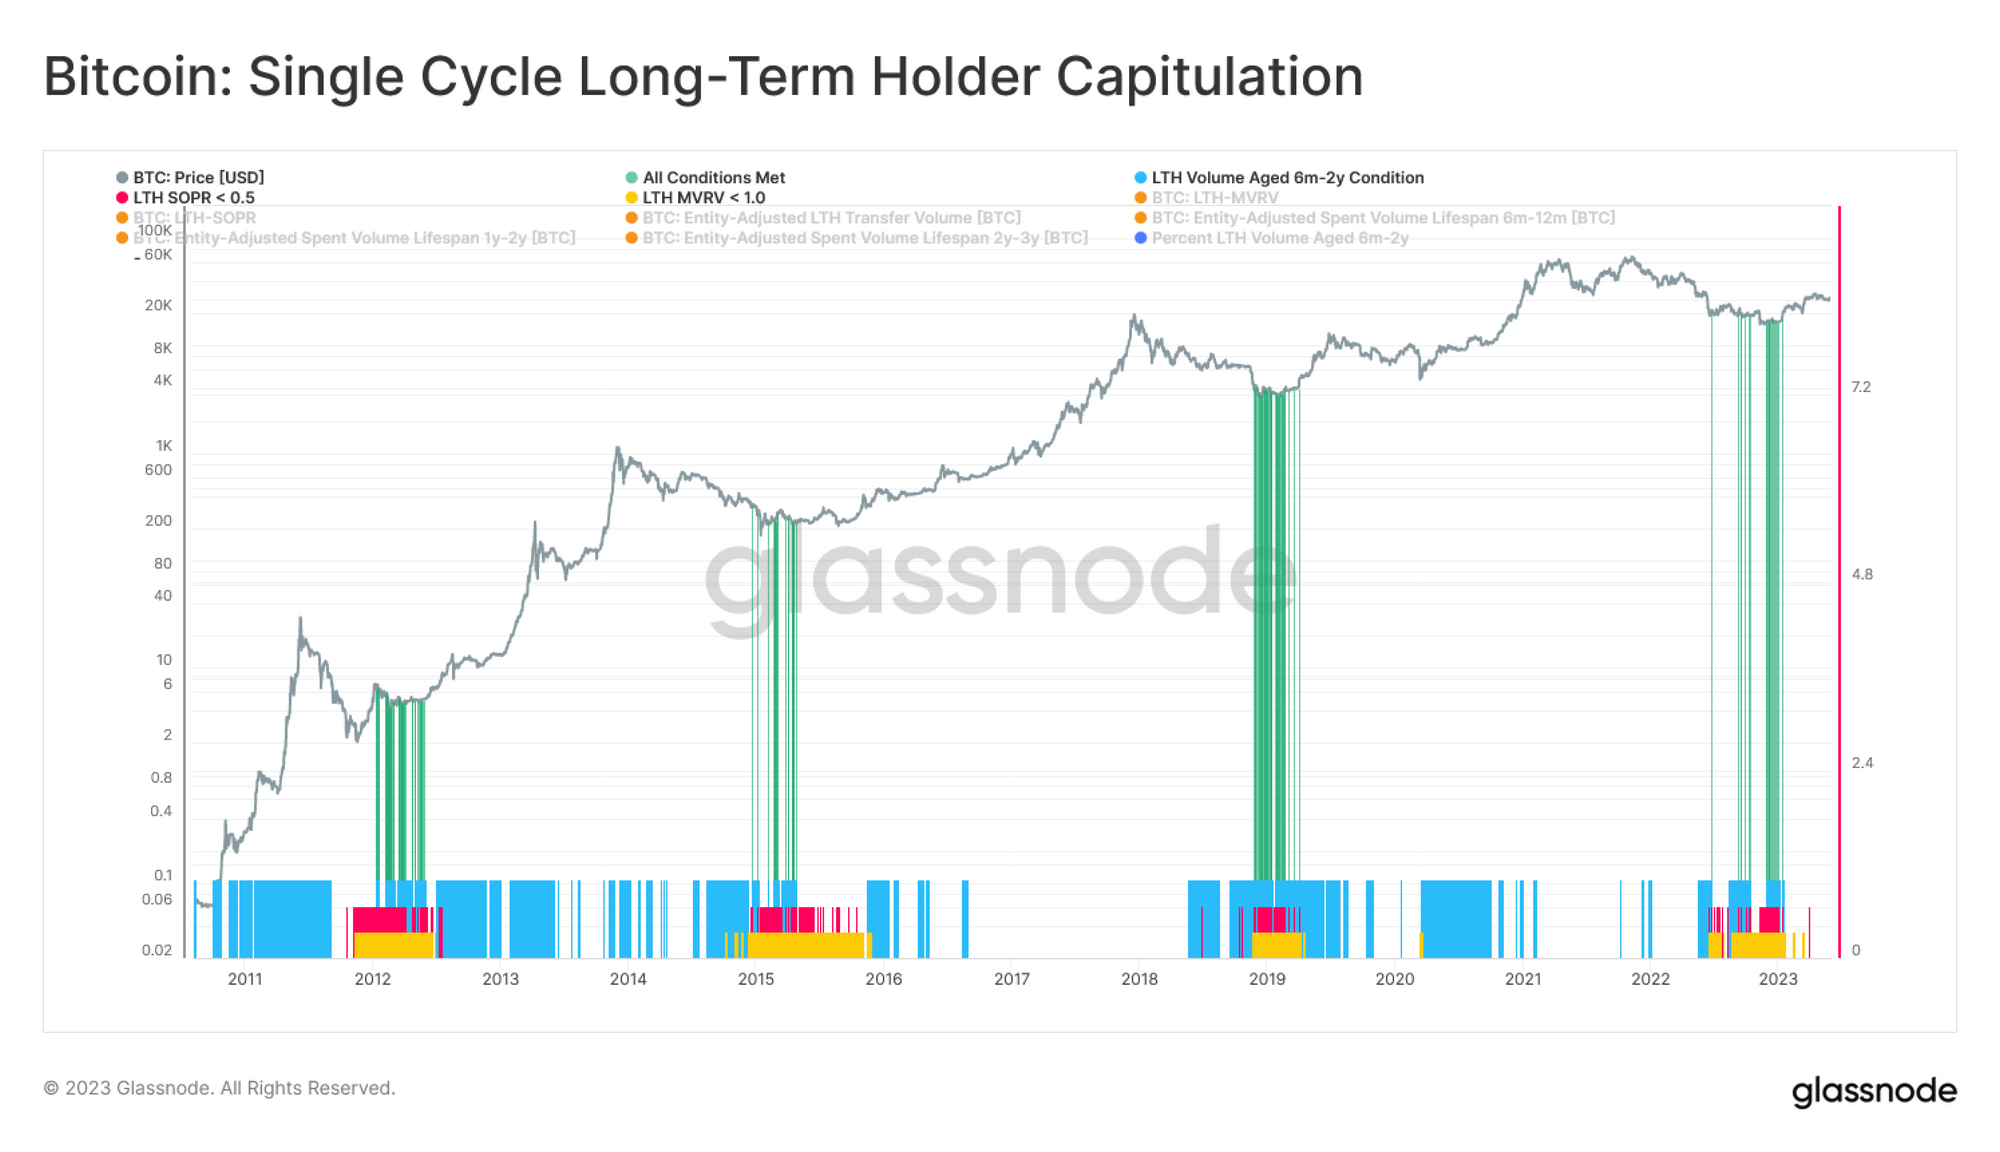
We have identified three measurable behavior patterns, which we can then compile into an actionable signal:
- 🟡 LTH-MVRV trades below 1 indicating unrealized stress is beginning to peak (signifying many LTHs bought high).
- 🔴 LTH-SOPR trades below 0.5 indicating that LTHs are not only locking in losses, they are of a magnitude exceeding -50% on average (signifying many LTHs sold low).
- 🔵 Single cycle LTH volume dominance exceeds 0.5 standard deviations from the mean. This indicates that the majority of LTH volume (which is contributing to LTH-SOPR) is indeed sourced from the least experienced of the cohort (signifying the least experienced).
When all three conditions align 🟢, this tool will indicate that the cohort of single cycle LTHs are experiencing a painful wash-out event, with some progressing along the Bitcoin market cycle learning curve.
Conclusion
Bitcoin investors are rarely born resilient HODLers. Many enter the market during peak bull market euphoria, only to see their average cost basis get set at painfully expensive prices. We can observe this particular subset weather much of the bear market storm, holding coins which lose more than half their value, only to capitulate in unison at the exact wrong time.
Interestingly, this tale of the new investor is as old as markets themselves. With on-chain data, we are now able to observe it in full color.
- SEO Powered Content & PR Distribution. Get Amplified Today.
- PlatoAiStream. Web3 Data Intelligence. Knowledge Amplified. Access Here.
- Minting the Future w Adryenn Ashley. Access Here.
- Buy and Sell Shares in PRE-IPO Companies with PREIPO®. Access Here.
- Source: https://insights.glassnode.com/buying-high-and-selling-low-the-long-term-holder-learning-curve/

