- In GMT, buyers push the price up to a new weekly high of $0.3168.
- Investors should proceed with caution, according to technical indicators.
- During the upswing, the bear’s attempt to seize the market was short-lived as $0.26 support was found.
STEPN (GMT) bulls found a safe haven at $0.2595 and rode it to a new weekly high of $0.3168. With this uptrend in bullish momentum, GMT price jumped to $0.2991, an increase of 15.27% as of press time
The 15.19% increase in market capitalization to $179,405,221 and the 156.29% increase in 24-hour trading volume to $67,157,350 support the uptrend in GMT and posit that market interest is soaring.
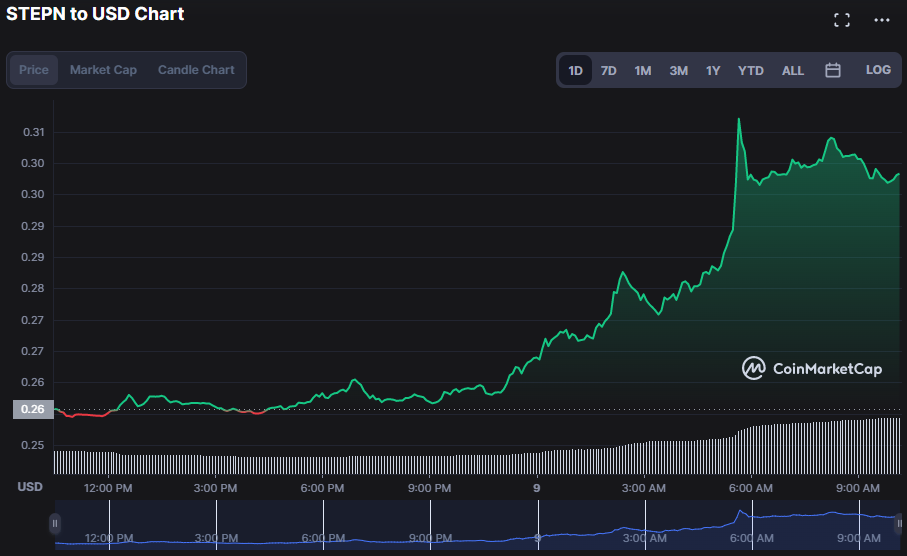
In the midst of the upswing, the GMT market price fluctuated between $0.2595 and $0.307. Assuming bulls maintain their strength, the price is likely to rise above $0.3169, with $0.3725 as a possible next resistance point. Breaking above the $0.3169 resistance level could be interpreted as a strong bullish signal, suggesting a move to a new high of $0.3725.
However, if this bullish power fades, the market price is likely to find support at the lower level of $0.2595, with further downside possible if it fails to hold as a support.

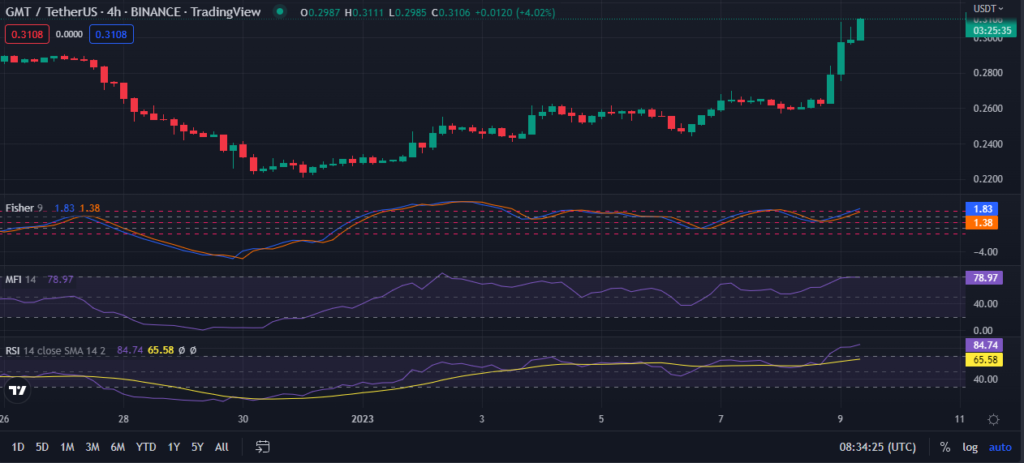
The trend of the Fisher Transform in the positive region and above its signal line with a reading of 1.83 indicates that the bullish trend may continue in the near future. This suggests that the current buying sentiment will likely continue, as will the market’s bullish momentum.
Furthermore, the relative strength index (RSI), with a reading of 84.29, indicates that the current buying momentum is likely to continue in the near future. This, combined with the high level of market volume, could indicate further bullishness. However, because the RSI is in the overbought zone, traders should proceed with caution.
A Money Flow Index value above 70 indicates that the underlying security is overbought. The GMT MFI reading of 78.83 may therefore be interpreted as a signal to investors that a potential pullback or correction is imminent.
If the current positive trend in the GMT market is to continue, the bulls must push prices higher and guard the resistance level.
Disclaimer: The views and opinions, as well as all the information shared in this price analysis, are published in good faith. Readers must do their own research and due diligence. Any action taken by the reader is strictly at their own risk, Coin Edition and its affiliates will not be held liable for any direct or indirect damage or loss.
Post Views: 15
- SEO Powered Content & PR Distribution. Get Amplified Today.
- Platoblockchain. Web3 Metaverse Intelligence. Knowledge Amplified. Access Here.
- Source: https://coinedition.com/bullish-tenacity-elevates-gmt-price-by-21-34-to-weekly-high/

