Bitcoin price declined below the $36,000 zone. BTC tested the $34,650 support zone and is currently consolidating losses near $35,500.
- Bitcoin declined heavily after the US CPI declined more than expected.
- The price is trading below $36,500 and the 100 hourly Simple moving average.
- There is a key bearish trend line forming with resistance near $36,050 on the hourly chart of the BTC/USD pair (data feed from Kraken).
- The pair could trade in a range before the bulls attempt a new increase in the near term.
Bitcoin Price Revisits Key Support
Bitcoin price failed to surpass the $37,500 resistance. BTC started a fresh decline from the $37,423 high and declined below many supports. There was a move below the $36,000 and $35,500 levels. The price even spiked below $35,000.
It retested the $34,650 support zone. A low was formed near $34,666 and the price is now correcting losses. There was a move above the $35,000 level. The price climbed above the 23.6% Fib retracement level of the recent drop from the $37,423 swing high to the $34,666 low.
Bitcoin is now trading below $36,500 and the 100 hourly Simple moving average. There is also a key bearish trend line forming with resistance near $36,050 on the hourly chart of the BTC/USD pair.
On the upside, immediate resistance is near the $35,680 level. The next key resistance could be near $36,000 or the trend line. The trend line is close to the 50% Fib retracement level of the recent drop from the $37,423 swing high to the $34,666 low.
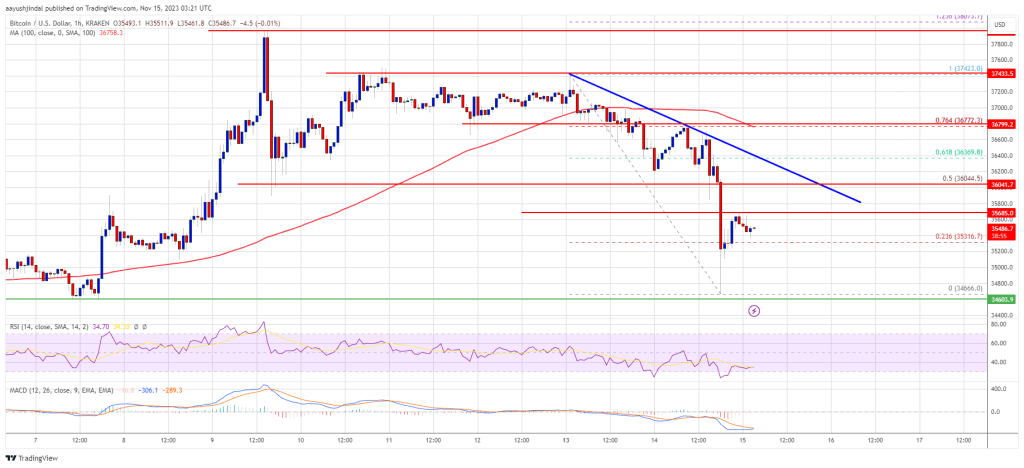
Source: BTCUSD on TradingView.com
The first major resistance is near $36,780, above which the price might accelerate further higher. In the stated case, it could test the $37,000 level. Any more gains might send BTC toward the $37,500 level, above which the price could gain bullish momentum and rally toward $38,000.
More Losses In BTC?
If Bitcoin fails to rise above the $36,000 resistance zone, it could continue to move down. Immediate support on the downside is near the $35,150 level.
The next major support is $35,000. If there is a move below $35,000, there is a risk of more downsides. In the stated case, the price could drop toward the key support at $34,650 in the near term.
Technical indicators:
Hourly MACD – The MACD is now losing pace in the bearish zone.
Hourly RSI (Relative Strength Index) – The RSI for BTC/USD is now below the 50 level.
Major Support Levels – $35,150, followed by $34,650.
Major Resistance Levels – $36,000, $36,780, and $37,000.
- SEO Powered Content & PR Distribution. Get Amplified Today.
- PlatoData.Network Vertical Generative Ai. Empower Yourself. Access Here.
- PlatoAiStream. Web3 Intelligence. Knowledge Amplified. Access Here.
- PlatoESG. Carbon, CleanTech, Energy, Environment, Solar, Waste Management. Access Here.
- PlatoHealth. Biotech and Clinical Trials Intelligence. Access Here.
- Source: https://www.newsbtc.com/analysis/btc/bitcoin-price-takes-hit-34650/

