Join Our Telegram channel to stay up to date on breaking news coverage
The Bitcoin price prediction gains 0.24% as bulls keep working hard to nurture a bullish trend above the moving averages.
Bitcoin Prediction Statistics Data:
- Bitcoin price now – $17,219
- Bitcoin market cap – $333.9 billion
- Bitcoin circulating supply – 19.2 million
- Bitcoin total supply – 19.2 million
- Bitcoin Coinmarketcap ranking – #1
BTC/USD Long-term Trend: Bearish (Daily Chart)
Key levels:
Resistance Levels: $19,000, $21,000, $23,000
Support Levels: $16,000, $14,000, $12,000
BTC/USD is hovering at the $17,219 resistance level as the market price stay above the 9-day and 21-day moving averages, indicating a bullish movement. For the past few days, the Bitcoin price has been following the bullish movement and in the context of the Bitcoin exchange rate forecast; an application of $18,000 resistance is expected.
Bitcoin Price Prediction: Will BTC Break Above $18,000 Level?
Looking at the daily chart, if the Bitcoin price can move near the upper boundary of the channel, it is likely for the market price to touch the potential resistance level of $18,000 level. This is where traders should expect buyers to fight for a further rise in the market so that the king coin can create additional gains. Meanwhile, looking at the market movement, there is likely that the Bitcoin price could experience a quick retracement or sell-off just in case it touches the crucial support level of $17,000 but if not; traders may see the coin breaking above the upper boundary of the channel to push higher.
Therefore, any further bullish movement could hit the resistance levels of $19,000, $21,000, and $23,000 respectively. On the downside, if the market price slides below the moving averages, BTC/USD could head toward the lower boundary of the channel, and if that support fails to hold the sell-off, the Bitcoin price could see a further decline toward the support levels of $16,000, $14,000, and $12,000. As revealed by the technical indicator, the market may gain more if the Relative Strength Index (14) crosses above the 60-level.
BTC/USD Medium-term Trend: Bullish (4H Chart)
On the 4-hour chart, traders expect the coin to gain the lost momentum so that it could move toward the upper boundary of the channel. Meanwhile, if the selling pressure exists and the coin couldn’t follow the upward movement, $17,000 and below may come into play.
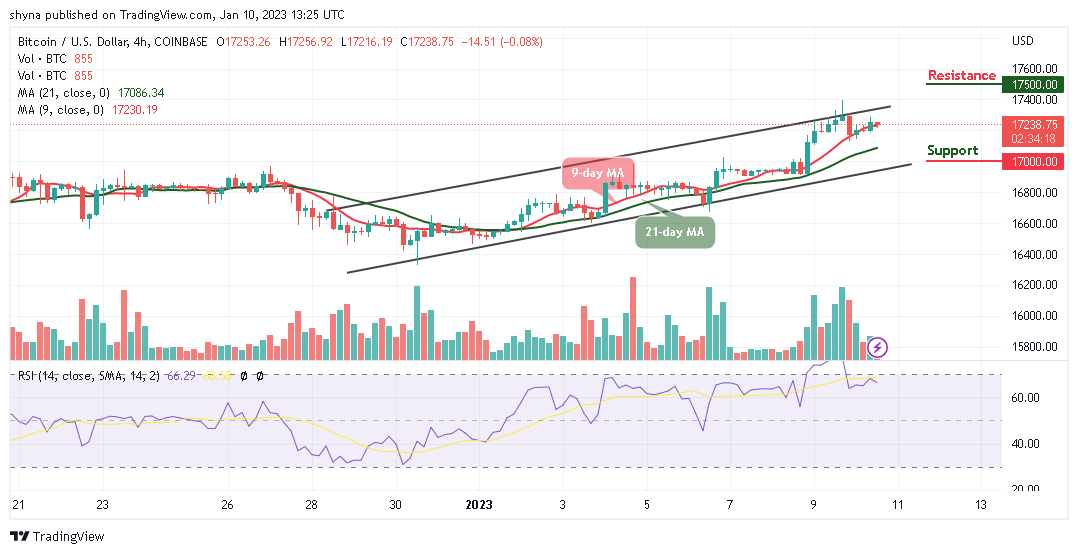
On the other hand, if the buyers keep the price above the 9-day and 21-day moving averages, traders may expect a strong bullish movement above the channel that could hit the resistance at $17,500 and above. Meanwhile, the technical indicator Relative Strength Index (14) is hovering below the 70-level, suggesting that the market price could fall.
Nonetheless, Dash 2 Trade gives you the ability to optimize your trading and speculative profitability with effective crypto trading recommendations, auto trading, and analytics features. There is a D2T token presale ongoing and time is running out. Almost $15 million has been raised so far. You can check the platform beta version here.
Related
Dash 2 Trade – Presale Ends Soon
- Active Presale Live Now – dash2trade.com
- Featured in Cointelegraph – $13M Raised
- KYC Verified & Audited
- Native Token of Crypto Signals Ecosystem
- Upcoming Listings Jan 11 – Gate.io, Bitmart, LBank, Changelly
Join Our Telegram channel to stay up to date on breaking news coverage
- SEO Powered Content & PR Distribution. Get Amplified Today.
- Platoblockchain. Web3 Metaverse Intelligence. Knowledge Amplified. Access Here.
- Source: https://insidebitcoins.com/news/bitcoin-price-prediction-for-today-january-10-btc-usd-looks-for-a-direction-will-18k-come-to-focus

