SNEAK PEEK
- BTC faces bearish pressure as prices drop, but a rebound may be imminent.
- Volatility prompts investors to reassess BTC exposure.
- Despite the market downturn, BTC shows resilience and potential for price increases.
Bitcoin’s (BTC) volatility has always been a concern for investors, and its recent resurgence into the breakout range is no exception. With this in mind, it may be wise for investors to reassess their exposure to BTC and consider cutting back on their investments. While Bitcoin has shown remarkable resilience in the past, many unknowns still surround its prospects.
bitcoin back into the breakout range, thats never a good sign, might be time to cut some exposure again#btc pic.twitter.com/G1Md2bllD9
— Bluntz (@Bluntz_Capital) May 31, 2023
However, bears have taken control of the Bitcoin market over the past 24 hours, driving the prices from an intraday high of $28044.76 to an intraday low of $27019.14. At the time of writing, persistent bearish pressure had caused the price to fall by 2.11% to $27199.46.
Due to the recession, BTC’s market capitalization decreased by 2.11% to $527,363,995,697, while the 24-hour trading volume increased by 24.19% to $15,615,123,177. This move indicates that despite the decrease in market capitalization, there was still significant trading activity during the recession.
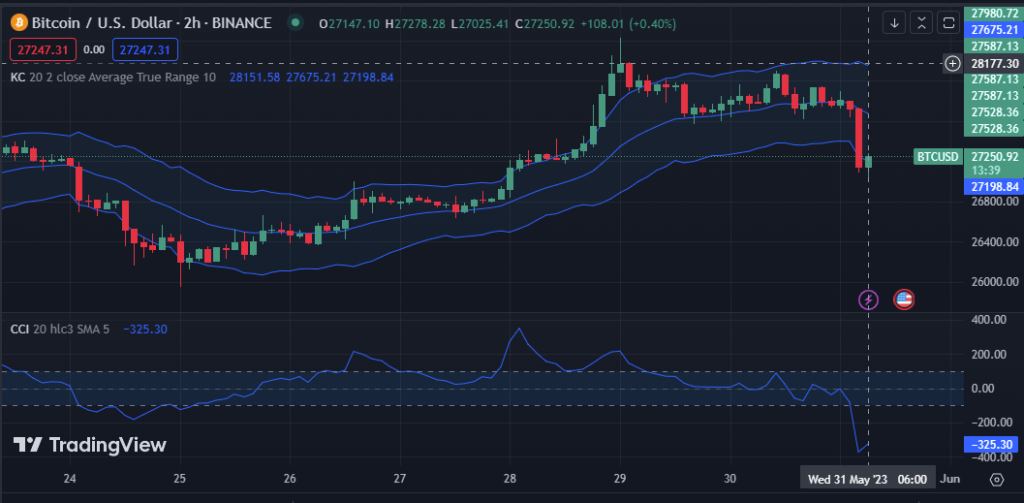
The upper and lower values of the Kelter Channels (KC) are 27587.13 and 27250.09, respectively, on the price chart of the BTC market. This movement indicates a significant downtrend in the market. If the price movement breaks through the bottom line, it might indicate that the downward trend will continue and offer opportunities for profit-taking or short-selling.
The Commodity Channel Index (CCI), which is negative, with its line facing South, has a value of -325.30 on the 2-hour price chart of the BTC market. This movement indicates that the market is experiencing strong selling pressure and that a price reversal will likely happen soon. BTC is currently less expensive, but a price increase may be on the horizon.
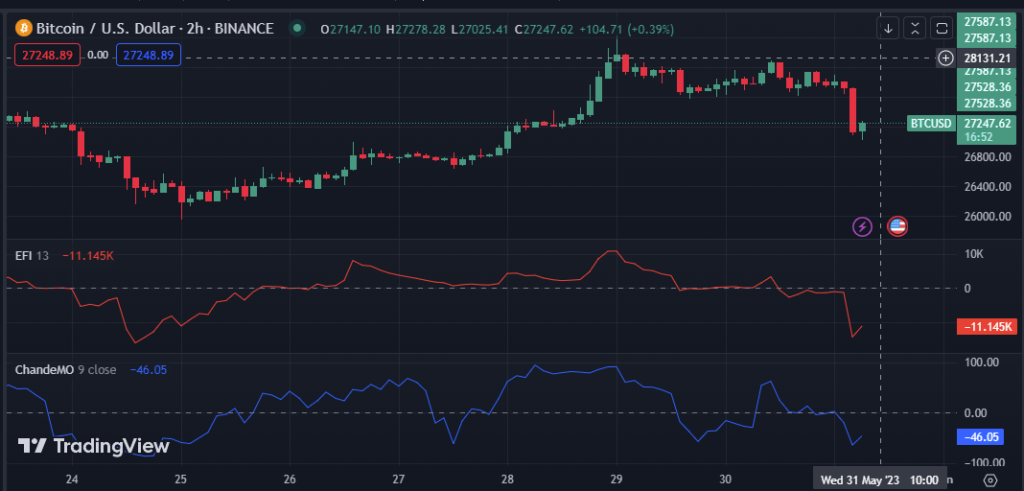
The Chande Momentum Oscillator (ChandeMO) on the 2-hour price chart of the BTC market is in negative territory with a value of -46.05. This motion suggests that BTC has been dropping quickly on the market and may be due for a brief bounce because it is currently oversold.
On the 2-hour price chart for the BTC market, the Elder Force Index (EFI) is negative with a value of -11.145k, indicating greater selling pressure in the market, which may portend a continued bearish trend. Although the price of BTC has dropped, a significant price increase could be on the horizon.
In conclusion, BTC’s recent volatility raises concerns, prompting investors to reconsider exposure. Bearish pressure persists, but potential rebounds and profit-taking opportunities may lie ahead.
Disclaimer: Cryptocurrency price is highly speculative and volatile and should not be considered financial advice. Past and current performance is not indicative of future results. Always research and consult with a financial advisor before making investment decisions
- SEO Powered Content & PR Distribution. Get Amplified Today.
- PlatoAiStream. Web3 Data Intelligence. Knowledge Amplified. Access Here.
- Minting the Future w Adryenn Ashley. Access Here.
- Buy and Sell Shares in PRE-IPO Companies with PREIPO®. Access Here.
- Source: https://investorbites.com/bitcoin-btc-price-analysis-31-05/

