ADVERTISEMENT
The Bitcoin fractal that was responsible for the March 2020 crash, could appear again as the cryptocurrency is going to form a Death Cross in June 2020 as its 50-day moving average slips below the 20-day moving average as we are reading further in our latest Bitcoin news.
Bitcoin will eventually repeat the bearish pattern in June 2020 which led its spot price to get to lower than 60 points. The daily charts of the number one cryptocurrency could form a Death Cross if it continues to struggle below the $10,000 price point. In the meantime, the Bitcoin fractal indicator shows a bearish divergence. The technical indicators flash a long-term moving average which crosses below the short-term moving average. The traders see this as a signal of a potential market sell-off so that Bitcoin can start a new bear cycle.
BTC/USD Chart By Tradingview
It seems that Bitcoin will form the Death Cross when the 50-day moving average will slip below the 20-day moving average and if the bearish crossover shows up, it will be the second Death Cross since the March crash. The last time this happened, Bitcoin was left out in a very bearish bias as the trading advisory firm noted. The cryptocurrency dropped by more than 60 percent after the 50-20 MA crossover. The analysts at Tradingshot said:
“Of course, [bitcoin’s downside move] was very much fueled by the stock market crash (related to the COVID outbreak). So the effects of this MA20/50 Bearish Cross may have not been so devastating on any other occasion, but I have to highlight it regardless. Unfortunately, BTC is close to forming this Cross in the next week if it doesn’t sustain the Higher Lows sequence.”
Bitcoin’s death cross also shows up when the asset has a hard time sustaining the bullish bias above $10,000. The technical resistance level defied the traders’ breakout on different occasions since February 2020. The failure to clear the obstacle could even lead bitcoin to invalidate the price increase since March 2020. Another break below the $10,000 could invalidate the bearish projections including the Death Cross. The analysts also noted irregularities in the March 2020 fractal compared to the ongoing bitcoin trend. The company noticed differences in the Relative Strength index indicating a bullish narrative.
ADVERTISEMENT

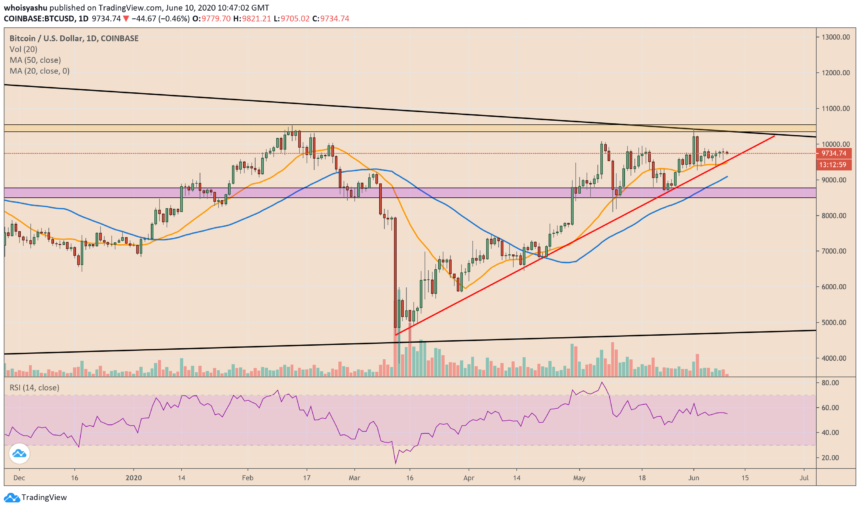
BTC/USD 1-Day Chart (Source: Newsbtc.com)
The RSI represents the magnitude of the recent price change to evaluate whether Bitcoin is now in overbought or oversold territory. Bitcoin’s old RSI was trending alongside the price which confirmed the bearish bias. On the other hand, the current RSI shows a bearish divergence which means the RSI is going sideways.
DC Forecasts is a leader in many crypto news categories, striving for the highest journalistic standards and abiding by a strict set of editorial policies. If you are interested to offer your expertise or contribute to our news website, feel free to contact us at [email protected]asts.com

