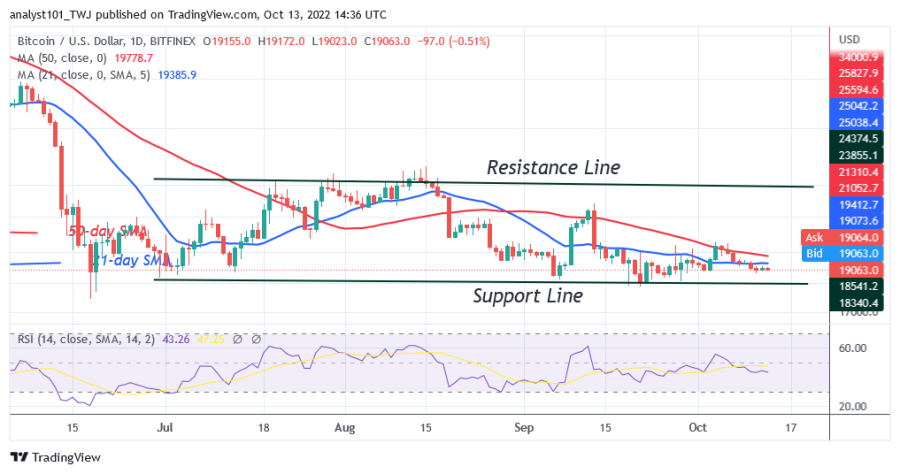
Bitcoin price (BTC) is in a downtrend, but has consolidated above the $19,000 support in the last three days.
Bitcoin price long term forecast: bearish
The recent downtrend was formed when buyers failed to keep the price above the $20,400 price level. Selling pressure at the recent high caused the bitcoin price to fall to the low of $19,024 at the time of writing this article
Sellers will try to break the $19,000 support, which has held since September 27. The largest cryptocurrency risks further decline if the current support is broken. It is likely that Bitcoin will regain the previous low at $18,210. Nonetheless, buyers need to vigorously defend the $18,000 support to avoid another decline. In previous price action, bulls bought the dips when the cryptocurrency fell to the low of $18,210 on September 21. Meanwhile, sellers are still testing the $18,210 support to break it.
Bitcoin indicator display
The recent decline has pushed the BTC price to level 42 on the Relative Strength Index for the period 14. It is in the downtrend zone and is vulnerable to a decline. The selling pressure may continue as the price bars below the moving average lines. It is in the downtrend zone below the 50% area of the daily stochastic. Currently, the downside momentum has eased as the BTC price hovers above the $19,000 support.

Technical Indicator
Key resistance zones: $30,000, $35,000, $40,000
Key support zones: $25,000, $20,000, $15,000
What is the next direction for BTC/USD?
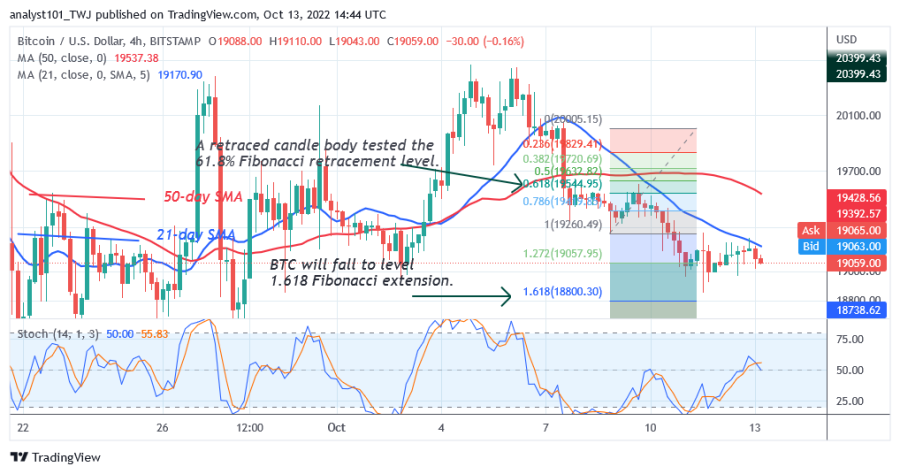
On the 4-hour chart, the Bitcoin price has declined significantly as it has reached the oversold area of the market. On October 8, Bitcoin corrected lower and a candlestick tested the 78.6% Fibonacci retracement level. This correction indicates that the cryptocurrency value will decline, but will reverse at the level of the 1,272 Fibonacci extension, or $18,800.30.

Disclaimer. This analysis and forecast are the personal opinions of the author and are not a recommendation to buy or sell cryptocurrency and should not be viewed as an endorsement by CoinIdol. Readers should do their own research before investing in funds.


