- MATIC fluctuated in the red zone during the first half of the week but gained momentum in the second half.
- The bears did let bulls off the hook after MATIC broke the bullish falling wedge.
- The RSI is tilting downwards at 67.75, hence MATIC prices could surge.
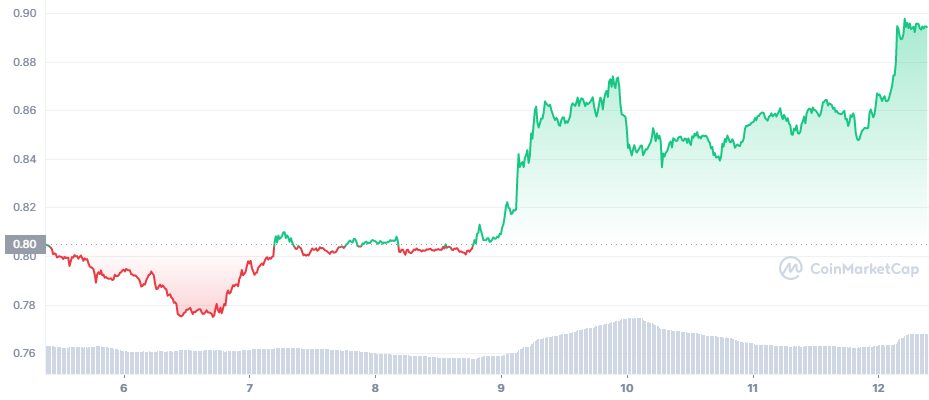
Polygon (MATIC) opened the week trading at $0.8. During the first three days of the week, MATIC fluctuated in the red zone touching the green zone on rare occasions. In the course of its descent, MATIC reached $0.7749 as the lowest price for the week.
Interestingly, as shown below in the chart, the token gained some momentum during the second day of the week. Although during this phase, the bulls weren’t able to push MATIC higher but were able to consolidate its prices.
However, the second half of the week was totally different from the first half as the bulls defied the bears and MATIC gained some momentum. As such, MATIC spiked from $0.8031 to 0.8061 in just a few hours.
MATIC traded in a bullish falling wedge in early November, as shown in the chart below. However, once it broke from it, the bears did not let the bulls run rampant from late November to mid-December.
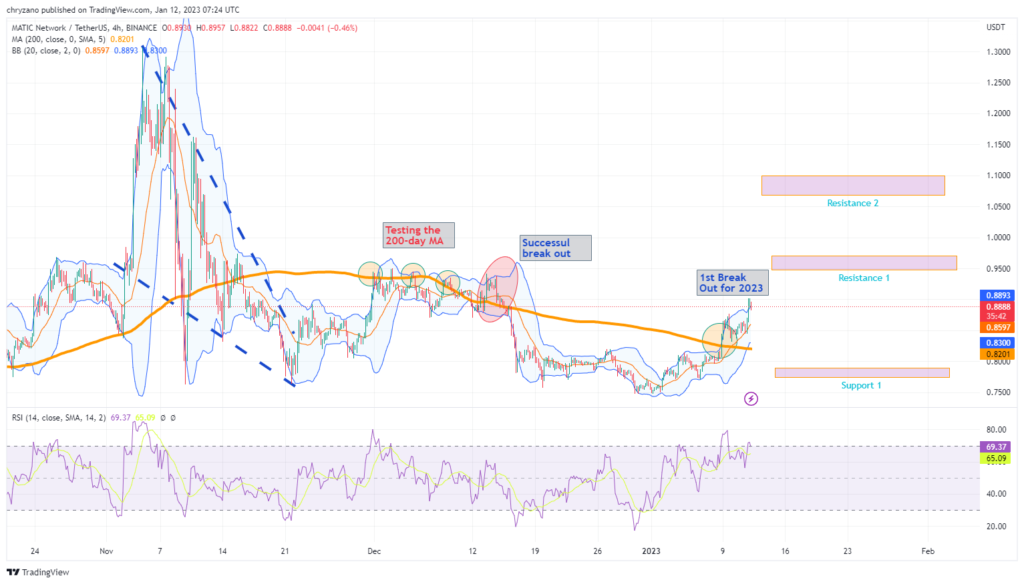
MATIC was only able to test the 200-day MA (green circle) on numerous occasions. Even when MATIC broke the 200-day MA (red elliptical), the bears made sure that MATIC did not leverage its breakout.
On the flip side, the bulls also fought hard to keep MATIC tanking below support 1. Due to the hard-fought battle by the bulls, MATIC moved sideways, fluctuating between the 200-day MA and support 1 from mid-December to early January.
MATIC broke out of the 200-day MA for the first time in 2023 on January 9. If the bulls push harder, MATIC could reach resistance 1 (≈$0.95), and with more pressure from the bulls, MATIC may rise to resistance 2 (≈$1.1). However, MATIC has touched the upper Bollinger band, hence the market could correct the prices.
Though MATIC touched the upper Bollinger band, it has not still reached the overbought region. The RSI is at 67.75 and is tilting down. As such, MATIC may still surge.
Contrarily, if the bears take over, MATIC may crash below the 200-day MA and fall on support 1.
Disclaimer: The views and opinions, as well as all the information shared in this price analysis, are published in good faith. Readers must do their own research and due diligence. Any action taken by the reader is strictly at their own risk, Coin Edition and its affiliates will not be held liable for any direct or indirect damage or loss.
Post Views: 8
- SEO Powered Content & PR Distribution. Get Amplified Today.
- Platoblockchain. Web3 Metaverse Intelligence. Knowledge Amplified. Access Here.
- Source: https://coinedition.com/bears-hold-the-bulls-matic-breaks-out-of-bullish-falling-wedge/

