
Published 21 hours ago
ADA Price Prediction: In the weekly time frame chart, the Cardano coin price showed the formation of an inverted head and shoulder pattern. This bullish reversal pattern is often spotted at the market bottom increasing the chances of a trend reversal. Thus, the ongoing recovery in ADA price will soon challenge the pattern’s neckline resistance which will intensify the underlying bullish momentum of this coin. Here’s how interested traders may trade this pattern.
advertisement
Key Points:
- A potential breakout from the $0.427 resistance will trigger the head and shoulder pattern.
- The weekly candle showing several higher rejection candles indicates the ADA price consolidates below the $0.427 barrier before the actual breakout.
- The intraday trading volume in the ADA coin is $321.5 Million, indicating a 39.5% loss
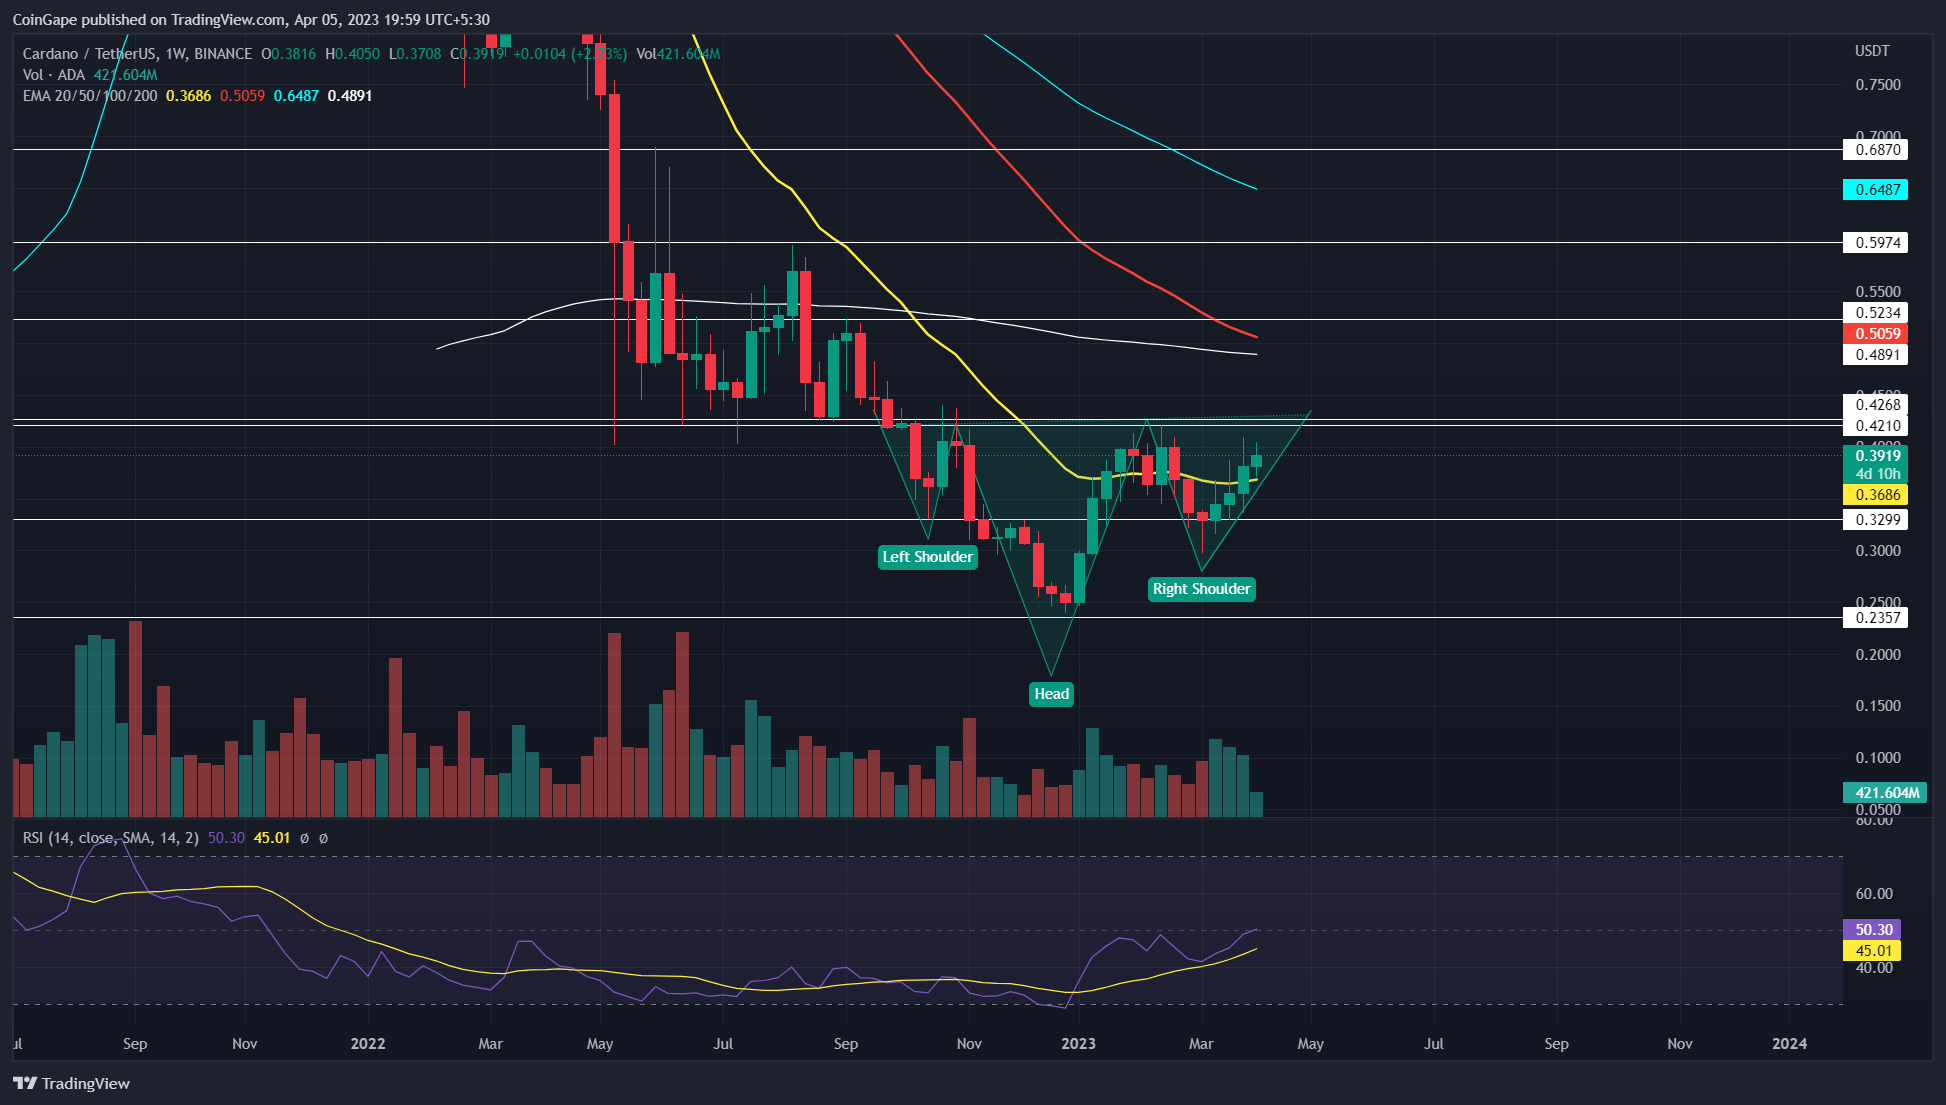
Source- Tradingview
A V-shaped recovery from $0.3 support forms the right shoulder of the head and shoulder pattern. Over the last five weeks, the Cardano price registered a 33.5% gain and reached the current price of $0.398.
Defying the ongoing uncertainty in the market, the ADA price maintained a steady recovery indicating sustained growth and commitment on the buyer’s side. If the buying pressure, the ADA price will rise another 7.5% to hit the $0.427-$0.42 neckline of the aforementioned pattern.
Trending Stories
However, interested buyers should be cautious at this $0.42 mark, the Cardano price may phase high sellers at multi-month resistance.
Also Read: What Is Regenerative Finance (Refi) And Who Is It For?
Anyhow, a potential breakout from the neckline resistance with a daily candle closing above will offer buyers a strong stepping strong to carry further price rallies. If the coin price sustains above the $0.427 mark, the buyers may carry a sustained recovery of 40% to reach the $0.6 peak.
Technical Indicator.
Relative Strength Index: The weekly RSI slope surged above the midline which was last observed in November 2021 gives an additional confirmation for trend reversal.
EMAs: The rising RSI slope reclaimed the 20 EMA of the weekly chart providing an additional edge to market buyers.
Cardano Coin Price Intraday Levels
- Spot price: $0.395
- Trend: Bullish
- Volatility: Low
- Resistance level- $0.426 and $0.52
- Support level- $0.3 and $0.23
Share this article on:
advertisement
The presented content may include the personal opinion of the author and is subject to market condition. Do your market research before investing in cryptocurrencies. The author or the publication does not hold any responsibility for your personal financial loss.
<!– Close Story–>
- SEO Powered Content & PR Distribution. Get Amplified Today.
- Platoblockchain. Web3 Metaverse Intelligence. Knowledge Amplified. Access Here.
- Source: https://coingape.com/markets/ada-price-prediction-potential-breakout-from-multi-month-resistance-sets-cardano-price-for-40-rally/

